
Gold’s price corrected considerably lower last week and seems to stabilise at the current stage. Yet fundamentals are evolving and could substantially affect gold’s price. In today’s update we are to have a look at the trade negotiations currently taking place between the US and China and the upcoming interest rate decision of the Fed. For a rounder view we are also to provide a technical analysis of gold’s daily chart.
- We make a start with the latest developments in the US-Sino trade relationships. Negotiations between the two sides have begun since Friday, given the meeting of US President Trump with Chinese President Xi, on Thursday in South Korea. It should be noted that progress was reported in meetings between US Trade Secretary Bessent and Chinese Trade officials, in the sidelines of the Asean summit in Malaysia. Characteristically Bessent said that the scenario of 100% tariffs being applied on chinese products by the 1st of November, has been eliminated. On the flip side the Chinese are expected to ease limitations on exports of rare earths. Also Bessent stated that the two sides have “reached a substantial framework for the two leaders”. Chinese trade officials seem to verify Bessent’s comments. Overall the tensions in the US-Sino relationships seem to have thawed, at least partially which tended to ease market worries leading to outflows for the precious metal. Should we see the US-Sino trade relationships improve further, we may see gold’s price retreating further.
- On Wednesday we get the Fed’s interest rate decision and the bank is widely expecting the bank to deliver a 25 basis points rate cut, while Fed Fund Futures imply that the market expects further easing of the bank’s monetary policy in the coming months. Hence should the bank cut rates as expected, the market’s attention is expected to shift towards the bank’s forward guidance which is to be included in its accompanying statement and Fed Chairman Powell’s press conference. The weakness of the US employment market tends to add pressure on the bank to continue cutting rates, yet the resilience of inflationary pressures as expressed by the release of the September CPI rates, tends to advise caution in further easing of the Fed’s monetary policy. It should be noted that Fed policymakers, seem to be split between the two possible directions. Should the bank signal intentions to further cut rates in the coming months, we may see gold’s price getting some support, while should Fed policymakers raise further doubts about extensive additional easing of the bank’s monetary policy we may see gold’s price weakening.
- Lastly we note that we are to get the preliminary US GDP rate for Q3 on Thursday and the release could be closely watched by gold traders as well. The rate is expected to slow down to 3.0%yy if compared to Q2’s 3.8% and such a development may initially allow for gold’s price to ignore the release as it would have been theoretically allready priced in by the markets but should the rate slow down more than expected, we may see market worries for the US macroeconomic outlook intensifying and thus creating safe haven inflows for the bullion. Also we may get September’s employment report with its NFP figure. Should the data show a considerably looser US employment market with the unemployment rate ticking up and the NFP figure dropping, we may see gold’s price getting some support and the contrary gold’s price could lose ground should the report show a considerably tighter than expected US employment market for the past month as the market may have to reposition its expectations for the Fed’s intentions.
Gold technical analysis
Gold’s price dropped last week and after some stabilisation seems to be showing some bearish tendencies as its price action is currently testing the 4000 (S1) support line. The breaking of the upward trendline that was guiding its price since the 19th of September is a clear signal of an interruption of the bullish movement hence we currently adopt a bias for a sideways motion of the precious metal’s price. It should be noted that the RSI indicator has dropped to the reading of 50 highlighting an erasing of the bullish market sentiment. On the other hand the bearish tendencies with today’s fall seem to be present. For a bearish outlook to emerge though we would require a clear break of the 4000 (S1) support line and the precious metal’s price to start aiming if not reaching the 3850 (S2) support level, a move that would allow us to draw also a downward trendline showing us the limitations of the downward movement. For a bullish outlook we would require gold’s price to break the 4185 (R1) resistance line and start aiming for the 4375 (R2) resistance level, which is also the record high level of gold’s price.
XAU/USD (Gold) Daily Chart
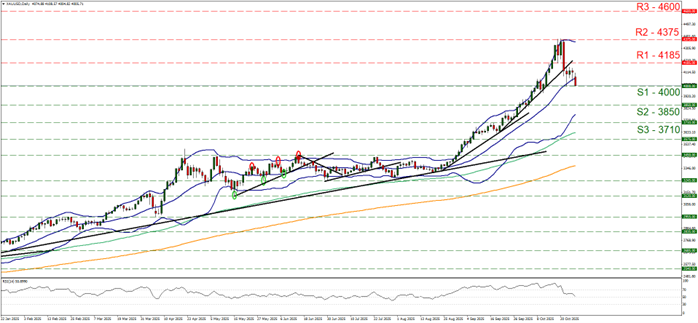
- Support: 4185 (S1), 4060 (S2), 3950 (S3)
- Resistance: 4375 (R1), 4500 (R2), 4650 (R3)


