
- As the potency of US-China de-escalatory negotiation talks worn out, crude traders diverted their attention back towards the prolonged oversupply issues, driving the Oil’s price closer to the $60 per barrel area.
- Traders fixated upon speculations that Saudi Arabia, the de facto leader of the oil cartel, OPEC+, plans to increase their production output in July, for a 3rd straight month, by 411k barrels per day, sparking concerns that global supply would exceed demand growth, which would add significant downward pressure on prices.
- Adding another bearish tilt to the equation and accelerating the fall of prices, was another week of US inventory pileups, broadcasting sustained lack of demand for the energy commodity.
- Crude traders will also closely monitor the geopolitical developments across the Middle East, in hopes that the fifth round of nuclear talks between US and Iran will be fruitful. Caution however is exercised since Israel has raised the possibility on conducting targeted strikes on Iranian nuclear facilities to eliminate entirely the prospect of military-grade uranium enrichment by the Iranians.
Technical Analysis of Oil
WTI Chart – Negative momentum drives WTI prices closer to fresh 4 year lows
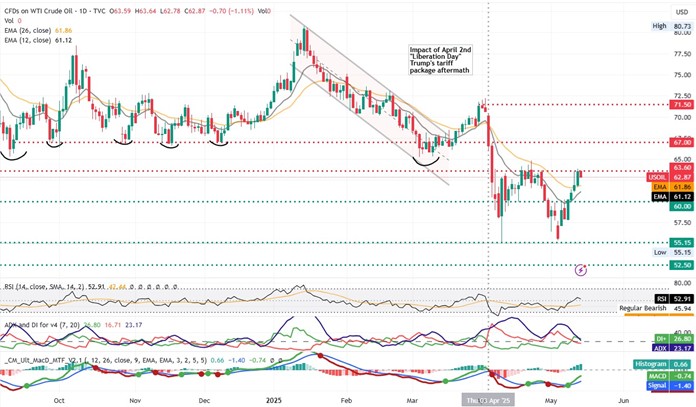
- Resistance: 63.60 (R1), 67.00 (R2), 71.50 (R3)
- Support: 60.00 (S1), 55.15 (S2), 52.50 (S3)
As oversupply worries persevered this week, energy bears managed to overpower the bullish momentum capping the commodity’s break above the $63.60 (R1) resistance level and pushed prices closer to the $60.00 per barrel (S1) support area. Given the development we switch our bias in favour for a bearish scenario, anticipating the return of the prices near the $55.15, 4 and half year low area. Supporting our case is the RSI indicator which registers a value of 45, after the bulls failed attempt to consolidate above the 50 threshold. At the same time, the failure of the price action to remain above both the 12 and 26 EMAs earlier this week further confirms the extension of the move towards the downside. Furthermore, the histogram of the MACD indicator below our chart, points to a weakening of the strength of the bulls, and the fact that both the MACD and signal lines remain below the threshold shores up a larger degree of probability for a move to the south. Should the bears take full control of the direction with strong momentum on their side, we would reasonably expect to see a break below the $60.00 (S1) support base and the fall of the commodity towards the $55.15 (S2) support area. Should on the other hand the bulls find enough resolve and elevate the price above the the 12 and 26 EMAs once again, we would reasonably expect to see WTI retesting and breaking definitively the $63.60 (R1) resistance level and climb towards the $67.00 (R2) resistance barrier.


