
- Crude futures effectively managed to stay above the $60 per barrel area over the past week and form a base, fluctuating undisturbed around the $62 per barrel level aided by quasi optimistic demand projections around tariff policies.
- More specifically the commodity found respite earlier this after US court of International Trade decided to declare Trump’s international trade strategies as unlawful, stating that the president has exceeded his authorities in doing so and ordered the complete suspension of the levies.
- The decision has improved outlook for higher demand, lifting crude prices higher, only temporarily however, as the President pushed back on the court’s ruling, appealing the case and asking for the tariffs to stay until a verdict reached by the Supreme court.
- Quickly fading were also the hopes of the US reaching a nuclear deal with Iran, as the Arabian nation noted that no follow up talks were scheduled. Furthermore, the looming possibility that Israel ponders on conducting targeted strikes on Iranian nuclear facilities to eliminate entirely the prospect of military-grade uranium enrichment by the Iranians, makes the situation even more worrisome.
- In other news, Chevron also halted output and exports in Venezuela after its US license was revoked by the US, disrupting over a third of the country’s crude shipments.
- Finally, once again traders are actively preparing to react to the outcome of the OPEC+ meeting which is scheduled on Saturday, of which additional output production hikes are expected to be announced and would most likely drag prices lower, yet an ultimate confirmation is needed.
Technical Analysis
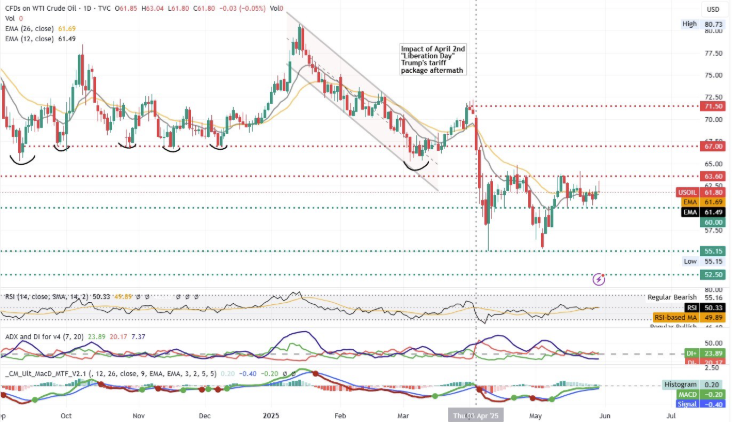
WTI Chart – WTI futures stuck around $62 per barrel area as traders await catalyst
- Resistance: 63.60 (R1), 67.00 (R2), 71.50 (R3)
- Support: 60.00 (S1), 55.15 (S2), 52.50 (S3)
WTI futures stayed stuck between $60 (S1) and $63.60 (R1) bounds over the past week as neither the bulls nor the bears took control of the direction of the commodity. Given the lack of any market moving developments, we switch our bias in favour for the prolongment of a sideway scenario, awaiting for a catalyst. Supporting the case is the RSI indicator which has flatlined around the 50 level signalling textbook indecision, the merging of price action with both the 12 and 26 EMAs but also the lack of momentum broadcasted by the ADX indicator and the tangled +DI and -DI lines, showcasing lack of either buying or selling asymmetrical pressure. Should the bears take control of the direction with strong momentum on their side, we would reasonably expect to see a break below the $60.00 (S1) support base and the fall of the commodity towards the $55.15 (S2) support area. Should on the other hand the bulls find enough resolve and elevate the price above the the 12 and 26 EMAs once again, we would reasonably expect to see WTI retesting and breaking definitively the $63.60 (R1) resistance level and climb towards the $67.00 (R2) resistance barrier.


