
Gold’s price dropped a drop that started on Wednesday and was renewed today and seems to adopt a bearish outlook, yet that may not be that clear yet. On a fundamental level we note the following:
- The latest news which affected the price of gold adversely was the easing of US-Sino trade tensions. Over the weekend, negotiations between the US and China took place, which were characterised as substantially productive and resulted in an agreement that both sides are to reduce the import tariffs imposed on each other’s products for the next 90 days. The developments practically improved the market’s sentiment provoking a more risk on stance on behalf of the market which understandably weighed on gold’s price, given its safe haven status. Any further thawing of tensions could weigh further on gold’s price.
- We note that the USD Index has been on the rise against its counterparts over the past few days, while gold’s price has been dropping, hence we could say that the negative correlation of the two trading instruments has been in effect. Should we see the USD strengthening further against its counterparts we may see it weighing on gold’s price. Also US yields have been on the rise thus they may have shifted investor’s attention
- As for financial releases we highlight tomorrow’s release of the US CPI rates for April. Market expectations are for the rates to remain unchanged at a core and headline level, on a year on year basis. Should the rates remain unchanged or even accelerate showing a relative resilience of inflationary pressures in the US economy we may see the release having a bearish effect on gold’s price as it may intensify the Fed’s doubts about the necessity of extensive rate cuts.
- The Fed seems to expect US President Trump’s tariffs to boost inflationary pressures in the economy while at the same views the US labour market as being stable and nearing full employment. Both tend to highlight the possibility of bank maintaining its wait and see position remaining on hold. Should we see further similar signals by Fed policymakers, thus forcing the market to readjust further its allready curtailed dovish expectations and thus weighing on gold’s price and vice versa.
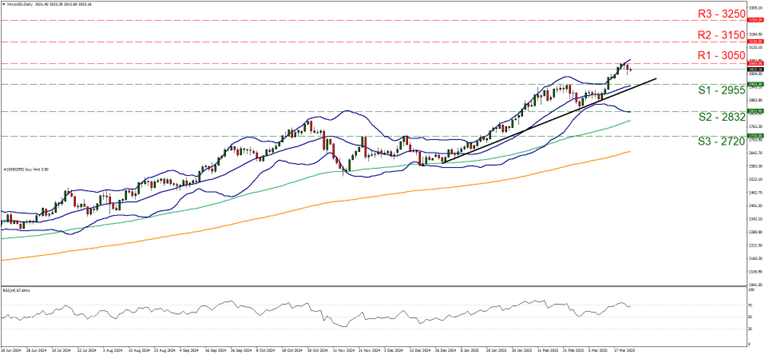
Technical analysis
On a technical level, we note that it’s been a roller coaster week for the precious metal’s price since our last report. Gold’s price action broke above the 3350 (R1) resistance line at some point even aiming for the ATH of the 3500 (R2) resistance level yet has since Wednesday has reversed direction and is currently aiming for the 3200 (S1) support level. The RSI indicator has dropped reaching the reading of 50, highlighting the erasing of the bullish sentiment among market participants, yet has still to drop further, before implying a bearish outlook for the precious metal.
Despite the drop of gold’s price, for the adoption of a bearish outlook for gold’s price, we would require it to form a lower trough than the last one formed on the 1st of May. Thus for a bearish outlook, the precious metal’s price has to break the 3200 (S1) support line clearly and start aiming for the 3057 (S2) support level. For a bullish outlook we would require gold’s price action to reverse direction, break the downward trendline characterising its motion since the 7th of May and continue to break the 3350 (R1) resistance line and line if not breach the 3500 (R2) resistance level.
- Support: 3200 (S1), 3057 (S2), 2955 (S3)
- Resistance: 3350 (R1), 3500 (R2), 3650 (R3)


