
Gold’s price maintained its sideways motion since our last report, yet the precious metal’s behavior tends to imply a wait and see position on behalf of the market as a number of issues is tantalizing the market. On a fundamental level we note the following:
- On Friday we saw the USD tumbling against its counterparts while at the same time gold’s price was supported, highlighting the negative correlation of the USD with the precious metal. Yet we have to also note that the movements were disproportional as the weakening of the USD Index, which describes the movement of the USD against a basket of other currencies, was substantial, while gold’s rise was barely notable. At the same time we also note the wide drop of US bond yields from Friday onwards with a simultaneous rise of gold’s price. Yet should we see in the coming week the USD continuing to lose ground substantially, we may see gold’s price being supported.
- On a monetary level, we note the Fed’s interest rate decision last Wednesday, at which the bank remained on hold as was widely expected and overall tended to imply that it’s in no hurry to cut rates, which in turn reduced the market’s dovish expectations. Yet the release was quickly overshadowed by the release of the US employment data for July. On a monetary level, we would find more interesting the resignation of Fed Board Governor Adriana Kugler. She tends to lean more on the hawkish side, and as a Fed Board Governor is a voting member, yet in the last meeting she was absent and did not vote. Her resignation practically provides the opportunity for US President Trump to nominate a dove which would favour an easing of the bank’s monetary policy as per Trump’s wishes. Furthermore any nominee once approved by the US Congress could act as a counterweight for Fed Chairman Powell acting in his shadow. Hence there are extensive market worries for the independence of the Fed. Should we see the Fed’s independence being further endangered, we may see market worries intensifying and thus providing possibly some support for gold’s price. In any case the market’s expectations are for the bank to cut rates twice these year once in September and once in October, and should such dovish expectations intensify we may see gold’s price gaining ground.
- On a macro level, the game changer over the past week was he release of the US employment report for July. Actually the wide drop of the NFP figure to 74k was disappointing as it was allready below the market’s expectations yet more worrying was the fact that the US Bureau of Labor Statistics (BLS) revised the NFP figures to the downside the NFP figures of June and May by an aggregated 258k. The head of BLS was fired by US President Trump, with some saying that she was incompetent, while others highlight that the corrections were not in Trump’s likening. In any case, the revised US employment data highlight a substantial, rapid, deterioration of the conditions in the US employment, which intensifies the possibility of an easing of the Fed’s monetary policy as mentioned before, yet also tends to intensify the worries for the US macroeconomic outlook despite the surprise acceleration of the US GDP advance rate for Q2.
- On a more fundamental level, the imposition of various tariffs by US President Trump on imports from various countries are not expected to be altered any time soon. Such an assumption was also implied by US Trade Representative Greer on Sunday. Yet negotiations are ongoing and could still lead to some trade agreements, which in turn may ease market worries and in such a scenario we may see the thawing of trading tensions weighing on gold’s price.
Gold technical analysis
Gold’s price was on the rise on Friday, yet overall tends to remain within the midst of the 3500 (R1) resistance line and the 3250 (S1) support level. The precious metal’s price, continued to moved in a sideways motion since our last report, the RSI indicator rose reaching once again the reading of 50, implying a relative indecisive market for the precious metal’s price and the Bollinger bands remained relatively tight implying low volatility for gold’s price, which in turn may allow the sideways motion of the shiny metal to continue. For a bullish outlook to emerge we would require gold’s price to break the All Time High level marked by the 3500 (R1) resistance line and we set as the next possible target for the bulls the 3650 (R2) resistance level. Should the bears take over ,we may see gold’s price breaking below the 3250 (S1) support line, which is also the lower boundary of gold’s current sideways motion, and start aiming for the 3122 (S2) support level, which was able to reverse gold’s downward motion on the 15th of May.
XAU/USD Daily Chart
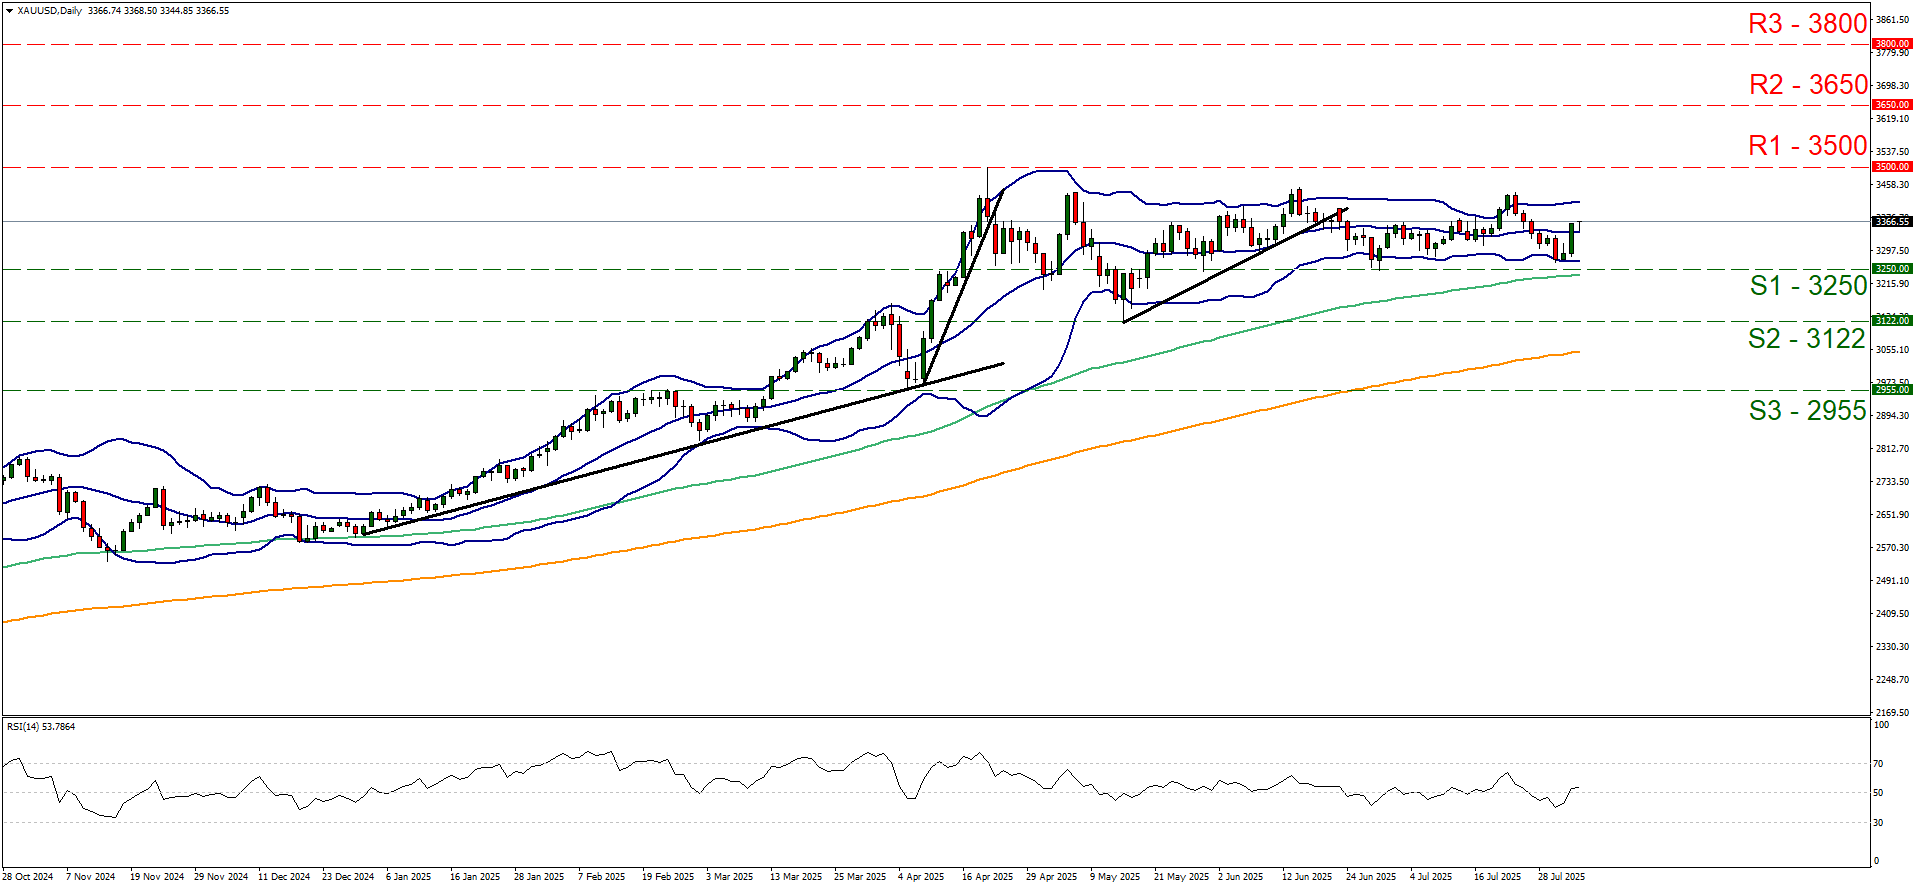
- Support: 3250 (S1), 3122 (S2), 2955 (S3)
- Resistance: 3500 (R1), 3650 (R2), 3800 (R3)


