
- Crude oil demand and supply forces appear to have reached an equilibrium point the last four weeks, as the lack of catalysts keeps traders on the sidelines, forcing them to sit on their hands in light of new information.
- WTI futures have been evidently gyrating aimlessly around the $66 per barrel area, since the ceasefire agreement between Iran and Israel, where we saw volatility plummeting and speculative bets dwindling.
- Furthermore, OPEC’s once upon a time, ground-shaking press announcements have now apparently lost their potency, being unable to move markets like before, as they became predictable and forecasters manage to effectively call them out in advance.
- Weekly crude oil inventory data from EIA and API institutes have also been largely put aside by traders, often adjourned as insignificant and largely overlooked.
- What has been nevertheless, the primary concern of traders in recent weeks, are the projected effects of President Trump’s tariffs and how US trade policies could impact the demand function of the energy commodity.
- So far, a “mutually beneficial” trade agreement was reached between US and China, and more recently, with Japan and now the attention of crude traders is fixated upon a possible deal with the European Union before the August 1st deadline.
- Markets nonetheless, remain optimistic and should a comprehensive deal gets officially sealed, we may see forecasters upwardly revising their targets for crude due to the expectations for higher demand, in combination with prospects of fewer supply disruptions.
Technical Analysis of Oil
WTI Chart – Crude futures remain rangebound as traders await for more trade deals data
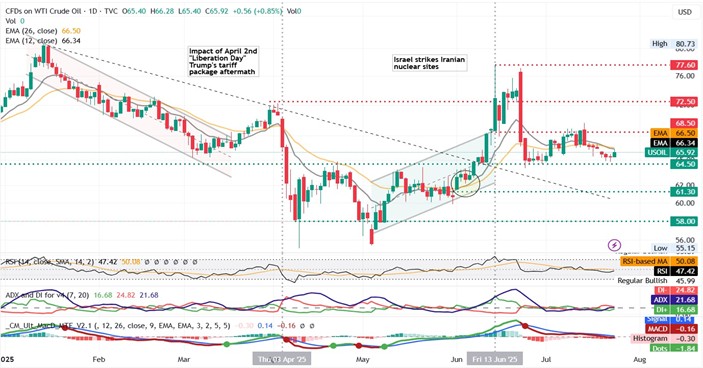
- Resistance: 68.50 (R1), 72.50 (R2), 77.60 (R3)
- Support: 64.50 (S1), 61.30 (S2), 58.00 (S3)
WTI futures continue to gyrate aimlessly between the $64.50 (S1) and $68.50 (R1) per bounds as traders scavenge for data to help them assess what may come next.
Given the lack of catalysts and therefore volatility, we maintain our sideways bias for the commodity, projecting the extension of the move within the aforementioned bounds. Supporting our case is the RSI value of 47 signalling indecision and the merging of the +DI and -DI, showcasing buying and selling pressures neutralizing each other, in tandem with a flatlined ADX.
Should the bulls take the initiative, we may see the commodity climbing above the $68.80 (R1) resistance level and after a successful break and head on to challenge the $77.50 (R2) area. Should the on the other hand the bears take over, we would reasonably expect to see a break below, the closest line of defence at the $65.00 (S1) support level, and head south, towards the $61.30 (S2) support zone.


