
Oil prices steadied in today’s Asian and European sessions following yesterday’s decline, as markets continue to monitor developments surrounding the US-Iran conflict. Attention is now shifting to reports that US, Iran preparing for another round of negotiations, even as geopolitical tensions remain elevated after recent disruptions in the Strait of Hormuz.
Expectations of renewed diplomatic engagement have helped stabilise sentiment in the oil market, while broader financial markets remain mixed, with US equities supported by risk-on appetite and the USD under pressure.
Oil prices stabilise ahead of US-Iran negotiations
Oil prices tended to stabilise in today’s Asian and European sessions, after suffering some losses yesterday. The oil market’s focus remains steadily on the developments of the US-Iranian conflict. Negotiations seem to be about to restart despite some hesitations by the Iranian side.
Over the past few days the situation grew more tense with the US seizing an Iranian tanker. It should be noted that the US side is increasing the pressure on Iran as US President Trump signalled that the US will not probably extend the current two week ceasefire deal. In parallel we note the wide US exports of oil towards Asia and at the same time we note that the US exports cannot substitute the loss of oil supply from the Straits of Hormuz.
Xlence Research Team opinion
On a fundamental level, the market seems to be seeing past the current tensions with hopes for a possible diplomatic arrangement increasing. Should such expectations intensify, we may see oil prices losing more ground. On the flip side should we see the US deadline coming to pass without further progress stoking market worries for an escalation of the US-Iranian conflict we may see oil prices rallying.
WTI H4 Chart
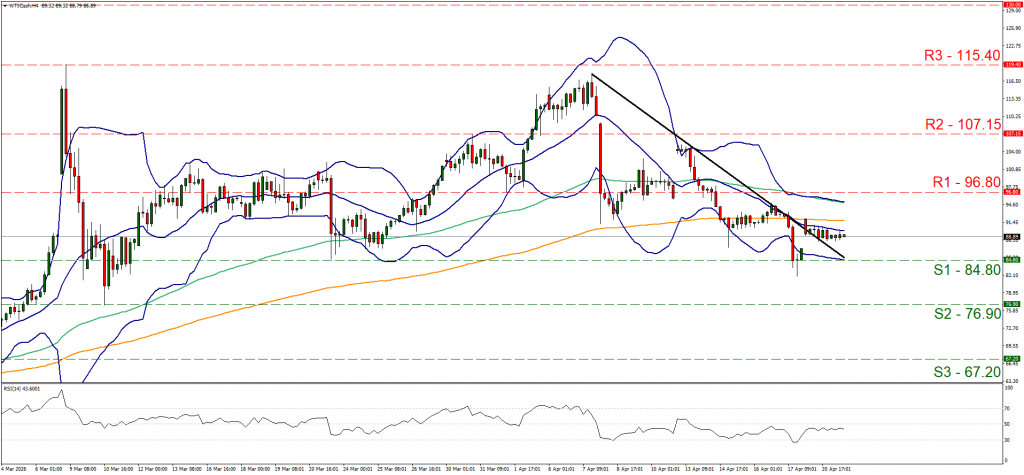
- Support: 84.80 (S1), 76.90 (S2), 67.20 (S3)
- Resistance: 96.80 (R1), 107.15 (R2), 115.40 (R3)
The drop of WTI’s price seems to have been halted and over the past 24 hours remained in the midst between the 84.80 (S1) support line and the 96.80 (R1) resistance level. As the stabilisation of the commodity’s price action has broken the downward trendline guiding it we switch our bearish outlook in favour of a sideways motion for now.
Should the bears regain the initiative wee may see WTI’s price breaking the 84.80 (S1) support line and start aiming for the 76.90 (S2) support level. Should the bulls be in charge of WTI’s direction, we may see it breaking the 96.80 (R1) resistance line and start aiming for the 107.15 (R2) resistance base.
The optimism of US stock markets remains
US stock markets remain optimistic despite the turbulence surrounding fundamentals, especially about the US-Iranian conflict. Overall the risk on market sentiment seems to be maintained, providing further support for US stock markets. In the specifics we note the replacing of Apple’s CEO Timothy Cook with the company’s hardware procurement chief, John Ternus.
We see the replacement of Tim Cook with John Ternus as a tack, a change of direction for Apple. Also the earnings season continues to create headlines and in today’s aftermarket hours we note the release of the earnings report of BHP group. Should the EPS and revenue figures excite traders and possibly be accompanied also by a positive forward guidance, we may see the share’s price getting some support.
Xlence Research Team opinion
Should we see the market’s mood remaining in a risk on mode, we may see US equities continuing to gain ground with major indexes possibly reaching new All Time High levels. On the flip side should we see market worries remerging turning market participants more cautious we may see US equities retreating.
US 100 Cash H4 Chart
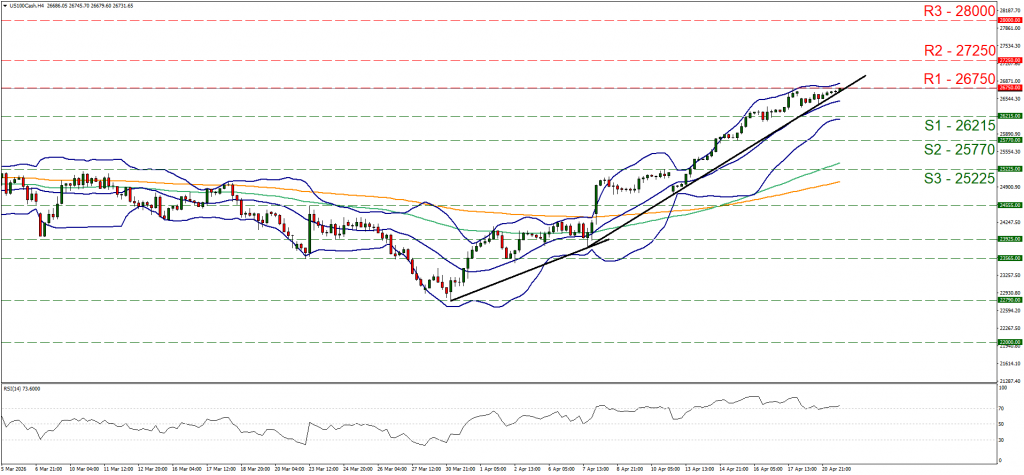
- Support: 26215 (S1), 25770 (S2), 25225 (S3)
- Resistance: 26750 (R1), 27250 (R2), 28000 (R3)
Nasdaq edged higher flirting once again with the All time High level of 26750 (R1) resistance level. The bullish market sentiment is evident as the RSI indicator remains above the reading of 70, yet at the same time the indicator may imply that the index is at overbought levels and prone to correct lower.
For the time being we maintain a bullish outlook given also that the upward trendline guiding it remains intact. Should the bulls maintain control as expected we may see Nasdaq breaking the 26750 (R1) resistance line and set as the next possible target for the bulls the 27250 (R2) resistance level.
Should the bears take over, which we consider currently as a remote scenario but still possible, we may see Nasdaq’s price action breaking the prementioned upward trendline, in a first signal of an interruption of the upward motion, continue to break the 26215 (S1) support level and start aiming for the 25770 (S2) support level.
USD loses ground in the FX market
The USD was on the retreat yesterday, as the improved market sentiment contradicted the greenback’s safe haven status, causing it to weaken against its counterparts.
We still consider the US safe haven status as the main factor behind its direction in the FX market, yet at the same time note that developments regarding the Fed may also play a role. We note the Senate Banking Committee’s hearing of Kevin Warsh’s nomination as the next Fed Chair.
Warsh is expected to go through a tough time and may pressured given that inflationary pressures are still present in the US economy. Should he sound more hawkish than what the market may be expecting we may see the USD gaining some ground, while dovish comments could weigh on the USD.
Xlence Research Team opinion
Should we see the market’s positive orientation be maintained, we may see the USD retreating in the FX market, while a more cautious approach may provide some support for the greenback.
USD/JPY H4 Chart
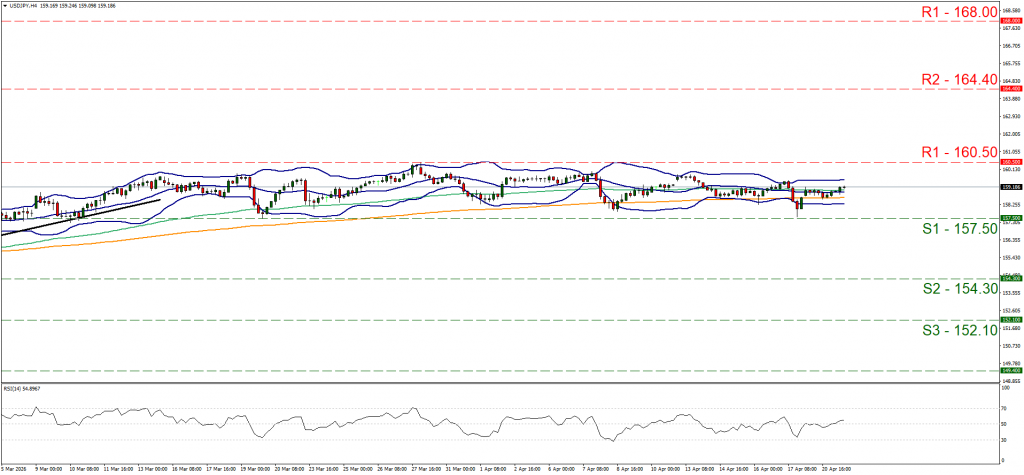
- Support: 157.50 (S1), 154.30 (S2), 152.10 (S3)
- Resistance: 160.50 (R1), 164.40 (R2), 168.00 (R3)
USD/JPY remained in a relatively tight range bound motion between the 160.50 (R1) resistance line and the 157.50 (S1) support level. We maintain our bias for the pair’s sideways motion to be maintained given that the pair’s main body of the price action has remained between the R1 and the S1.
Also the slight rise of the RSI indicator just above the reading of 50, is not convincing for the market’s bullish intentions for the pair. Nevertheless for a bullish outlook to emerge, we would require the pair’s price action to break the 160.50 (R1) resistance line and start setting the 164.40 (R2) resistance level in its sights.
For a bearish outlook to emerge, we would require USD/JPY’s price to break the 157.50 (S1) support line and start aiming for the 154.30 (S2) support level.
Disclaimer: This information is not considered investment advice or an investment recommendation, but instead a marketing communication.