
With the summer holidays over, September sets a number of fundamental issues on the path of gold traders. In today’s report we are to discuss a number of such issues affecting gold’s price but also attach a technical analysis of gold’s daily chart for a more complete picture. We make a start by noting the following:
- The negative correlation between the USD and gold over the past five days seems to have been reactivated as the USD is weakening against its counterparts while gold’s price has a distinct upward movement. Nevertheless, despite the movement of the two trading instruments being inverted is asymmetrical. Furthermore we note that US bond yields over the past week dropped and remained at relatively low levels if one considers the average for August, which tends to polish the shiny metal even further, as the attractiveness of US bonds, an alternative for gold investors tends to ease. Overall, should we see the USD continuing to weaken in the coming week, we may see gold’s price gaining further support.
- On a monetary level, the Fed’s intentions remain key for gold’s direction, one could dare to say that is the dominant issue at the current stage. As per Fed Fund Futures, the market currently seems to expect the bank to proceed with a rate cut in its next meeting, 17th of September, which is understandable given the easing of the US employment market, yet inflation remains stubbornly high in the US, suggesting caution in cutting rates. Also the pressure exercised by US President Trump on the Fed to ease its monetary policy is feeding the market’s dovish expectations. The recent incident at which the US President fired Fed Board Governor Lisa Cook was characteristic. In any case, should the markets’ expectations for a possible easing of the Fed’s monetary policy be enhanced we may see gold’s price gaining further ground, while should market expectations for the Fed to cut rates ease, we may see gold’s price slipping.
- Also on a fundamental level, we still highlight the war in Ukraine and the US import tariff policy as potential drivers of uncertainty in the markets. It’s characteristic that the US on the tariff war has reached a trade deal with major economies such as the EU, while at the same time is turning the screw on India, and a permanent trade deal with China remains elusive. Should we see the fighting in Ukraine intensifying further or friction in the international trade relationships of the US escalating further, we may see gold’s price getting safe haven inflows.
- Finally on Friday we highlight the release of August’s US employment report as an event that could shake gold’s price. Currently forecasts are for the unemployment rate to tick up to 4.3%, the NFP figure to rise slightly to 75k and the average earnings growth rate to slow down. All data forecasts tend to imply an easing of the US employment market which could add more pressure on the Fed to ease its monetary policy and should the actual rates and figures be even worse than expected, we may see Gold’s price getting some support and vice versa.
Gold technical analysis
The bullish tendencies of gold’s price are quite obvious over the past ten days or so as the precious metal’s price is aiming for the 3500 (R1) resistance line, a level that marks a record high level for gold’s price.
Additionally, we note that the RSI indicator has reached the reading of 70, implying a strong bullish sentiment for gold’s price. We also note though that the current level of the RSI indicator may imply that gold may be in an overbought market and ripe for a correction lower.
Similar signals are being sent by gold’s price action reaching the upper Bollinger band. Hence some degree of hesitancy still exists. For the adoption of a bullish outlook we would require gold’s price to reach new record high levels by breaking the 3500 (R1) resistance level and set as the next possible target for Gold’s bulls the 3650 (R2) resistance level.
For a bearish outlook to emerge we would require gold’s price to drop below the 3250 (S1) support line reversing all the gains of the past ten days and then some and start aiming for the 3122 (S2) support level.
XAU/USD Daily Chart
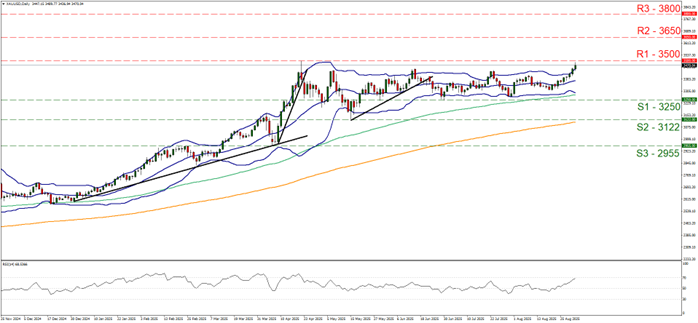
- Support: 3250 (S1), 3122 (S2), 2955 (S3)
- Resistance: 3500 (R1), 3650 (R2), 3800 (R3)


