Gold’s price has renewed its bullish tendencies since our last update. In the current update we are to have a look at the US financial releases that could shake gold’s price, the validity of the negative correlation of gold with the USD and latest developments that could affect the course of gold’s price. We are to conclude the report with a technical analysis of gold’s daily chart.
- With the Fed cutting rates as expected, the bank also seemed to be signalling a slowing of the rate cutting pace in the coming year with its new dot plot. Yet the struggle within the Fed for further easing of its monetary policy seems to be intense. Hence we highlight any further comments expressed by Fed policymakers as potentially moving gold’s price. Fed hawks such as Kansas Fed President Schmid and Chicago Fed President Goolsbee could make comments weighing on golds price, while doves such as NY Fed President Williams and Fed Board Governor Miran could make statements that lift gold’s price in the coming weeks.
- Yet in the coming week gold traders may be more interested in the release of the high impact US financial data such as November’s US employment report tomorrow. The NFP figure is expected drop to 40k if compared to September’s 119k, the unemployment rate fail to drop and remain unchanged at 4.4% and the average earnings growth rate to slow down to 3.6%yy if compared to September’s 3.8%yy. The prognosis tends to imply further cooling in the US employment market which may add more pressure on the Fed to cut rates further. Should we see the actual rates and figures implying a wider than expected slack in the US employment market we may see gold’s price getting some support while on the flip side should the data be better than expected showing a narrower slack or even a tightening of the US employment market, we may see the release weighing on gold’s price.
- Besides the US employment data we also note the release of the US CPI rates for November on Thursday and the PCE rates for October on Friday. Should the rates show a resilience of inflationary pressures in the USD economy, the release may add more pressure on the Fed to keep rates unchanged in order to tame inflation and thus the release could weigh on gold’s price and vice versa a possible easing of inflationary pressures could provide some support for gold’s price.
- Over the past few days we note that gold’s price has been on the rise while at the same time the USD index, a instrument monitoring the movement of the USD against a basket of other currencies, has been losing ground, marking a weakening of the USD against its counterparts. Hence one could assume that the negative correlation of the two trading instruments seems to be in effect since last Wednesday. Hence should we see the USD retreating further against its counterparts in the FX market, we may see gold’s price benefitting. Furthermore we note that the wide drop of US bond yields for the past week may have also aided the rise of gold’s price, as the drop of US bond yields may have increased the attractiveness of the shiny metal.
- Also on a geopolitical level we note the continuous efforts for a peace plan in Ukraine. Despite our hopes for an agreement to be reached are currently low, we must note that should such a deal be struck, or even more concrete evidence be presented for material progress in the peace negotiations, we may see gold’s price retreating as the market’s worries may ease.
Gold Technical analysis
Since our last update, gold’s price renewed its bullish tendencies by breaking the 4240 (S1) resistance line, now turned to support. Given that the price action has broken the upper boundary of its past sideways motion which we switch in favour of a bullish outlook for the precious metal and we intend to keep it as long as the upward trendline guiding gold’s price since the 28th of October, remains intact.
We also note that the RSI indicator has surpassed the reading of 70, implying the presence of a strong bullish market sentiment for the shiny metal’s price, yet at the same time the indicator may be implying that the precious metal’s price is at overbought levels and is ripe for a correction lower. We get similar signals from the upward direction of the median of the Bollinger bands, but also from the flirting of gold’s price action with the upper Bollinger band which may slow down the bulls or even cause a correction lower.
Should the bullish outlook to be maintained we would require gold’s price to break above the 4375 (R1) resistance line clearly, a level that marks an all time high level for the precious metal’s price and set as the next possible target for gold’s bulls the 4500 (R2) resistance barrier. For a bearish outlook to emerge, we would require gold’s price to drop, break initially the 4250 (S1) support line and continue to break the prementioned upward trendline clearly, in a first interruption of the upward movement and start actively aiming, if not reaching the 4130 (S2) support level.
XAU/USD Daily Chart
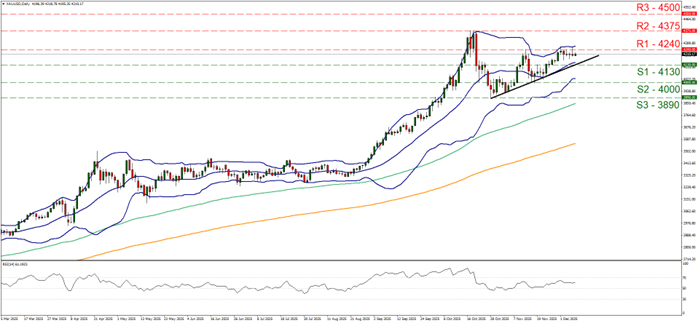
- Support: 4240 (S1), 4130 (S2), 4000 (S3)
- Resistance: 4375 (R1), 4500 (R2), 4650 (R3)