
- Crude oil returned to the $60 per barrel area earlier this week as the bullish momentum quickly dried out, with traders staying on the sidelines awaiting for a clear catalyst.
- The theme of weak demand was brought to the forefront once again, and its prevalence placed a cap on WTI futures, forcing the bulls to abandon their charge to higher ground. The advance of crude prices to the $61.50 area two weeks ago was primarily based around Washington’s plan to sanction Lukoil and Rosneft, two of Russia’s energy players, in attempts to punish Putin’s regime for not ending the war in Ukraine.
- Stockpiles in the US have recorded significant buildups according to government data amplifying concerns for an oversupplied market, with weak travel activity and reduced container shipment movement placing downward pressure on oil (WTI).
- More specifically EIA inventory data showcased a surprise rise of 5.2 million barrels last week, significantly above analysts’ estimates, who forecasted a 100k barrel drawdown instead. The build was the largest since July, according to MUFG analysts, raising fears over excess supply and adding further pressure to prices.
- OPEC+ also recently approved a modest production increase for December but plans to pause further hikes in early 2026, reflecting caution amid weakening demand.
- According to sources, Saudi Arabia has “significantly reduced the price of its crude for Asian buyers in December as OPEC+ continues to ramp up production, fuelling concerns that demand growth in the region may be softening”
Technical Analysis of Oil
WTI Chart – In the absence of volatility, crude futures gradually erase the swift gains made in prior 2 weeks
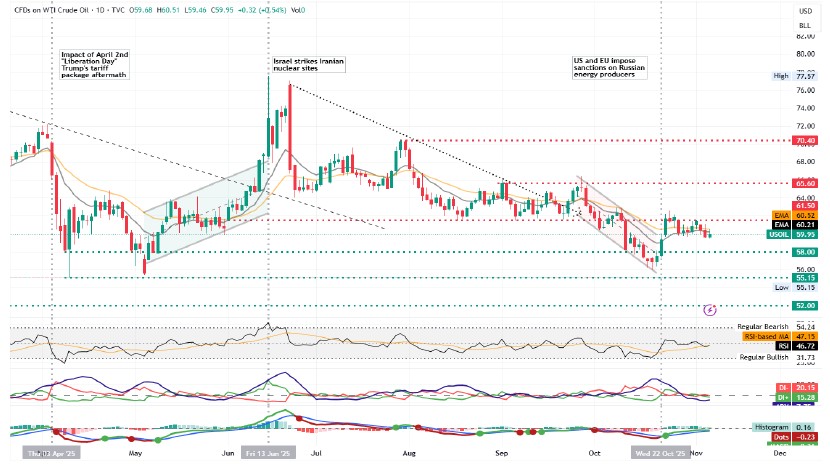
- Resistance: 61.50 (R1), 65.60 (R2), 70.40 (R3)
- Support: 58.00 (S1), 55.15 (S2), 52.00 (S3)
After failing to extend their rally above the $61 per barrel area crude due to weak buying activity, futures gradually returned to their former consolidation zone, trading between the $60.50 (R1) and $58.00 (S1) bounds. Given the lack of interest from either the bull or the bears, we switch our assessment in favour of the extension of the sideways motion, until a catalyst appears. The RSI value gyrates around the 50 level indicating indecision and with the ADX value below the 20 level, we get a clear sign the strength of the current move remains supressed. Should the bulls take hold of the initiative, we may see crude break definitively above the $61.50 (R1) resistance ceiling and head for the $65.60 (R2) resistance area. On the other hand, should the bears take over, we may see WTI revisiting the $58.00 (S1) support base and head for the $55.15 (S2) support area.