
Gold’s price rallied over the past week with a number of fundamental issues fueling the rise of the precious metal’s price. The market’s expectations for the Fed, the recent release of the August US employment data and wide uncertainty are all subjects that may be affecting gold’s price. The comment is to be complemented by a technical analysis of gold’s daily chart. On a fundamental level we note the following:
- Starting with the negative correlation of the USD with gold’s price, we tend to see it as being inactive. On the one hand we acknowledge that the USD on Friday weakened against its counterparts, while at the same time gold’s price was on the rise in a signal that the negative correlation is active. Yet on the other hand should one have a look at movement of the two trading instruments for the past three weeks, he/she will notice that the gold’s price was in an upward motion, while the USD Index remained in a sideways movement. Hence we tend to maintain the view that the negative correlation of the USD with gold’s price is currently inactive.
- It should be noted that the gold bulls were revived from the release of the US employment report for August. The release showed that the US employment market was even weaker than expected. It is characteristic that the unemployment rate ticked up as expected to reach 4.3%, while the NFP figure dropped beyond market expectations reaching 22k and average earnings growth rate slowed down to 3.7%yy if compared to July’s 3.9%. Overall the release enhanced market expectations for the fed to ease its monetary policy, an issue that we will be examining at the next paragraph. In the coming week, besides the release of the Fed’s interest rate decision we note the release of the US CPI rates for August on Thursday, and a possible acceleration of the rates implying a persistence of inflationary pressures in the US economy, could weigh on gold’s price and vice versa.
- On a monetary level, as mentioned the release of the US employment report for August provided some support for the gold’s price as it enhanced the market’s expectations for the Fed to cut rates. It is characteristic that the market after the release started to price in the possibility of the Fed cutting rates of 50 basis points in its September meeting, while the base scenario is for the bank deliver a 25 basis points rate cut. The market also expects the bank to deliver a rate cut in October and another one in December. Should the bank cut rates as expected, market attention is expected to shift to the bank’s forward guidance which is to be included in the Fed’s accompanying statement and Fed Chairman Powell’s press conference later on. Should the bank, with its forward guidance enhance the market’s dovish expectations, we may see the release providing some support for gold’s price. On the flip side, should the bank express some hesitation on further rate cuts we may see the market, being forced to readjust its expectations which in turn may weigh on gold’s price.
Gold technical analysis
The bullish tendencies for gold’s price mentioned in the last report have now evolved in a full blown bullish outlook with the precious metal’s price reaching new record high levels by breaking the 3500 (S1) resistance line, now turned to support and starting to actively aim for the 3650 (R2) resistance level.
The RSI indicator has surpassed the reading of 70 and after a small correction is rising, implying a strong bullish sentiment on the one hand and on the other implying that the precious metal’s price has reached an overbought level and is ripe for a correction lower.
Similar signals come from the fact that gold’s price action is flirting with the upper Bollinger Band. We intend to maintain a bullish outlook for gold’s price as long as the upward trendline guiding it since the 28th of August remains intact.
Should the bulls remain in charge as expected, we may see gold’s price breaking the 3650 (R1) resistance line and set as the next possible target for the bulls the 3800 (R2) resistance level. Should the bears be in the lead, which we currently view as a remote scenario, we may see gold’s price dropping, breaking the prementioned upward trendline in a first signal that the upward movement has been interrupted, continue to break the 3500 (S1) support line and start actively aiming, if not breaching the 3250 (S2) support base.
XAU/USD Daily Chart
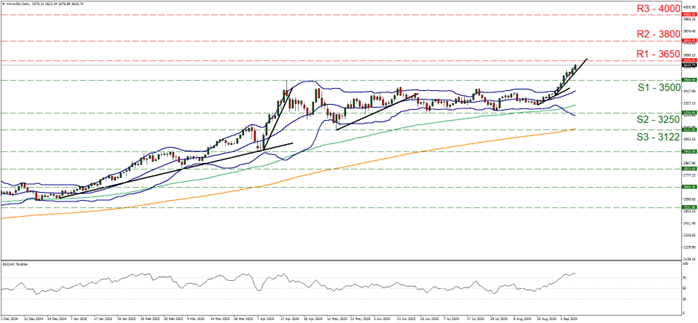
- Support: 3500 (S1), 3250 (S2), 3122 (S3)
- Resistance: 3650 (R1), 3800 (R2), 4000 (R3)


