
Despite fundamental issues such as the Trump-Putin meeting, the market’s change of hearts for the Fed’s intentions in the past month and a number of high-impact financial data being released, gold’s price remained relatively stable, possibly signaling a wait and see position on behalf of market participants. In today’s report we are to discuss a number of fundamental issues affecting gold’s price but also attach a technical analysis of gold’s daily chart. We make a start by noting the following:
- The negative correlation between the USD and gold seems to be inactive in the past two weeks. It’s characteristic that gold’s price remained relatively stable in that period while the USD index which describes the movement of the USD against a basket of currencies in the FX market, seems to have bearish tendencies over the same period forming lower peaks and troughs. Furthermore, we note that US bond yields since their wide drop on the first of the month, tended to edge a bit higher, yet remain unconvincing for a substantial rise. So there seems to be a lack of correlation between the US bonds and gold’s price as well. Should fundamentals surrounding gold’s price mark a revival of the negative correlation of the two trading instruments awe may see a possible weakening of the USD providing some support for gold’s price on a fundamental level.
- In the coming week only few high impact financial releases from the US, are on the calendar and practically very few if any of them could alter gold’s direction. Hence we turn our attention to the fundamentals of the market. One issue that we had highlighted in last week’s oil outlook as a potential market mover, was the Trump-Putin meeting in Alaska. The meeting took place last Friday and yielded little results if any. In any case it seems that the meeting acted as a kickstart event of a procedure which could lead to negotiations, a ceasefire or even a possible peace deal. For the time being we note that US President Trump is now to have a meeting with Ukrainian President Zelensky and then the leaders of Britain, Germany, France, Italy, Finland, the European Union and NATO, possibly trying to convince them for a land swap in favour of Russia, in exchange for peace. Should the meeting result in a improvement of the relationships of the west with Russia, we may see it weighing on gold’s price as market worries could ease. On the flip side should the meeting fail to produce a substantial result, we may see tensions with Russia escalating further which could provide safe haven inflows for the precious metal.
- Another issue that could affect gold’s price could be the market’s expectations for the Fed’s intentions. The market’s dovish expectations intensified after the release of July’s weak employment data, yet the market’s dovishness eased after the release of the US CPI, PPI and retail sales rates for July last week. Currently the market expects the bank to proceed with a rate cut in its September meeting and deliver another one until the end of the year. In the coming week, we note the release of the Fed’s last meeting minutes and we note that currently there seems to be a power struggle within the bank on how extensively to cut rates. Should the document signal a substantial shift by Fed policymakers towards easing extensively its monetary policy it could provide some support for gold’s price. The second issue we would like to highlight would be the Jackson Hole Summit over the coming weekend. The Summit has been traditionally used to announce major shifts in the Fed’s policy and should Fed Chairman Powell, signal in his speech the start of an easing of the Fed’s monetary policy, we may see gold’s price getting some support on Monday’s opening.
Gold technical analysis
Gold’s price, despite some edging lower over the past week, remained well between the 3250 (S1) support line and the 3500 (R1) resistance level, the all time high level of gold’s price. Given the gold’s movement over the past two months, we maintain our bias for the precious metal’s price action to maintain a sideways motion at the current stage.
The RSI indicator also remained relatively stable, running along the reading of 50, implying a relative indecisiveness for the precious metal’s direction. Also the Bollinger bands remained relatively tight, implying low volatility for gold’s price, which may allow the sideways motion to be maintained.
For a bearish outlook to emerge we would require gold’s price to drop below the 3250 (S1) support line and start aiming for the 3122 (S2) support level. For a bullish outlook we would require gold’s price to break the 3500 (R1) resistance line, entering unchartered waters and we set as the next possible target for the bullion the 3650 (R2) resistance level.
XAU/USD Daily Chart
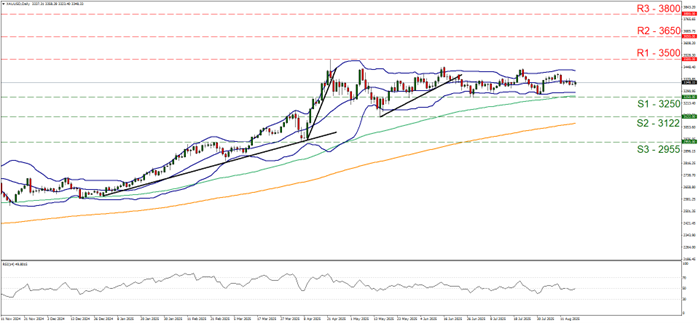
- Support: 3250 (S1), 3122 (S2), 2955 (S3)
- Resistance: 3500 (R1), 3650 (R2), 3800 (R3)


