Since our last outlook, gold’s price remained relatively stable until todays’ opening in the Asian session, as the precious metal’s price rallied. In today’s report we are to discuss fundamental issues affecting currently gold’s price. For a rounder view, we are also to provide a technical analysis of gold’s daily chart.
- On a fundamental level, we make a start with the developments in the US-Sino trade relationships. China announced that it’s to halt the banning of rare earth exports, among which Gallium, Germanium and Antimony. The announcement was made by China’s commerce ministry on Sunday and seem to be a direct result of the trade negotiations South Korea. It should be noted that China’s export ban has created a shortage of raw materials for US high tech companies, which in turn led to US companies to redirect supply chains by importing these goods through third countries. The easing of tensions in the US-Sino trade relationships tends to ease also gold’s safe haven appeal, thus could weigh on gold’s price. On the flip side, we may see the easing of Chinese restrictions on rare earth exports, falling short of US President Trump’s expectations and in such a case we may see tensions escalating once again and thus could create support for gold’s price again.
- The possible ending of the US Government shutdown is another issue that could weigh on gold’s price. In a latest development, in the US Senate a group of Democrats decided to reach a deal with the Republicans and passed a law that would extend finance for the US Government through January next year. Despite the financing of the US Government being for a rather short term period, should the House of Representatives also pass the bill, we may see safe haven demand for gold ease further, weighing on its price.
- To set a frame about how damaging the US Government shutdown has been on the US economy it’s characteristic that White House economic adviser Kevin Hasset stated that should the US Government shutdown be extended, US economic growth in Q425, could turn into negative. The statement may be over the top, yet the market worries are still there. The few financial data released last week, tend to provide a mixed signals with the manufacturing sector showing another, deeper this time contraction of economic activity, while the services sector accelerated the expansion of economic activity in the past month, both as per ISM. On the other hand the Challenger layoffs showed a tripling of layoffs in the past month, in another signal of the weakness of the US employment market, while the UoM for November, highlighted a less confident demand side for the US economy, while conditions seem to be worsening. Overall given the information black out imposed by the US Government shutdown bad news, or a worsening expectations on behalf of the market for the US economy could enhance its expectations also for the Fed to cut rates thus could provide support for gold’s price.
- Another issue of interest for gold traders would be the negative correlation of the USD with gold’s price. We note that the USD Index, which describes the movement of the USD against a basket of its counterparts, despite some slight bearish tendencies remained relatively stable. On the other hand gold’s price remained relatively stable until Friday and rallied in today’s Asian session. For us to view the negative correlation of gold with the USD being active, we would require a clear deviation of the direction of the two trading instruments, thus for the time being we tend to view it as inactive.
Gold Technical analysis
Gold’s price rallied in tomorrow’s Asian session breaking the 4010 (R1) resistance line clearly, turning the level into a support level. The upward motion of the precious metal’s price signalled the breaking out of the boundaries of gold’s past sideways motion, as the precious metal’s price has flirted with the 4010 (S1) former resistance line for the past two weeks, hence we adopt for the time being a bullish outlook. Also the RSI indicator has started to timidly rise higher, escaping also the reading of 50 to the upside. For the bullish outlook to be maintained, we would require gold’s price to continue rising, actively aiming for the 4185 (R1) resistance line, while even higher we note the 4375 (R2) resistance level, the All Time High level for gold’s price. For a bearish outlook to emerge, we would require gold’s price to drop, break the 4010 (S1) support line and continue to also break the 3810 (S2) support level, while even lower we note the 3630 (S3) support base.
XAU/USD Daily Chart
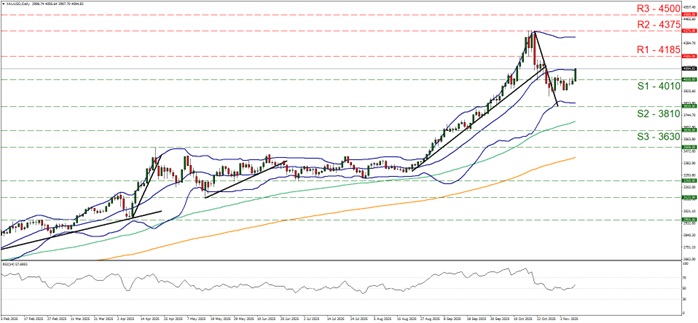
- Support: 4010 (S1), 3810 (S2), 3620 (S3)
- Resistance: 4185 (R1), 4375 (R2), 4500 (R3)