Since last week’s update, gold’s price rose but corrected lower again, surrendering the majority of the gains made. In today’s report we are to examine the validity of the negative correlation of the USD with gold’s price, have a look at how US bond yields have behaved and also make a comment about the Fed’s intentions and the market’s worries. For a rounder view, we are also to provide a technical analysis of gold’s daily chart.
- Starting with examining the validity of the negative correlation between the USD and gold’s price at the current stage. We note that the USD index which describes the movement of the USD against a basket of its counterparts, edged just a bit lower since our last report, while Gold’s price moved upward and corrected lower in a far more intense manner. Overall, there seems to be a negative correlation in the direction of the two trading instruments yet the movement of the USD is not material enough to claim that the negative correlation of the two trading instruments is currently valid. Should the two trading instruments follow opposite directions and intensify their movements, we may see the negative correlation being reinstated.
- Furthermore, we note that US bond yields over the past week, despite some ups and downs, tended to remain fairly stable at relatively low levels if compared to the levels they were in the past months. Hence, we do not adopt the reasoning that a rise in US bond yields at the current stage, unless it’s extraordinary, could make US bonds a lucrative alternative for safe haven investments to gold. Nevertheless, should we see US bond yields drop lower, we may see the attractiveness of the shiny metal being polished further.
- On a deeper fundamental level, the market’s expectations for the Fed’s intentions could be the main driver behind the move of gold’s price. For example, on Friday, the drop of gold’s price did not happen in a vacuum of fundamentals. Fed policymakers made statements stressing their doubts for the necessity of further easing of the bank’s monetary policy. It’s characteristic that Dallas Fed President Logan stated that it would be hard to support another rate cut in the December meeting, while Kansas Fed President Schmid signalled that the bank’s monetary policy is where it should be, while Atlanta Fed President Bostic underscored the uncertainty of a rate cut in the December meeting by stating, “We’ll see”. It’s also characteristic that the market no longer expects the bank to cut rates in the December meeting, with Fed Fund Futures implying a 60.9% for the bank to remain on hold. Should we see the market’s expectations for the bank to remain on hold in December and weakening further any expectations for the easing of the Fed’s monetary policy, we may see gold’s price retreat further.
- Another issue that seems to affect the path of gold’s price are the expectations of the market for the release of high-impact financial data from the US, given the ending of the US Government shutdown. Data showing a considerable cooling if not cratering of the US employment market, could raise once again the market’s expectations for the Fed to continue easing its monetary policy and thus could support gold’s price. The same applies to data showing a contraction of the GDP rate or even a substantial slowdown of the US GDP rates. On the contrary, data showing a resilience of inflationary pressures in the US economy by a possible acceleration of the CPI rates could enhance the Fed’s doubts for more easing and thus could weigh on gold’s price.
Gold technical analysis
Gold’s price proved unable to clearly break the 4185 (R1) resistance line and tumbled lower on Friday, stopping short of hitting the 4010 (S1) support level. As the upward motion of gold’s price we switch our bullish outlook in favour of a sideways motion for the time being. The RSI indicator has neared the reading of 50, implying a possible indecisiveness on behalf of market participants for gold’s direction, which could support our bias, while the converging Bollinger Bands tend to imply lower volatility for the bullion’s price which also could allow the sideways motion to be maintained.
Should the bulls take over we may see gold’s price breaking the 4185 (R1) resistance line clearly and start aiming for the 4185 (R2) resistance level, which also marks a record high level for gold’s price. On the flip side should the bears be in charge we may see gold’s price breaking the 4010 (S1) support line and pave the way for the 3810 (S2) support base.
XAU/USD Daily Chart
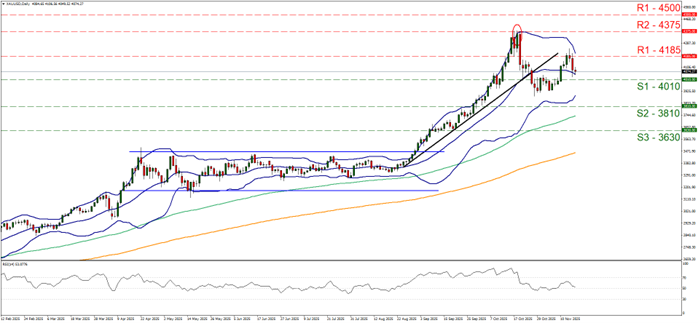
- Support: 4010 (S1), 3810 (S2), 3630 (S3)
- Resistance: 4185 (R1), 4375 (R2), 4500 (R3)