
Gold’s price has remained relatively stable since our last report. In the current report we are to have a look at various fundamental issues such as the inactive negative correlation of the USD with gold, the Fed’s stance and Trump’s tariff intentions.
We are to conclude the report with a technical analysis of gold’s daily chart. We make a start with fundamentals noting the following:
- Over the past week the USD had some ups and downs, remaining stable on Friday and edging lower in today’s Asian and European session, gold’s price on the other hand edged higher. Despite that one could argue, that the two trading instruments are following opposite directions, the movement of gold is immaterial, disproving any effect of USD’s movement on gold’s price. Also we note that US bond yields edged lower since our last report despite rising last Wednesday, yet once again with little effect on gold’s price.
- We also note the possible implications of the Fed’s monetary policy on gold’s price. Since our last report financial data from the US implied an intensification of inflationary pressures in the US economy in June, despite a slowdown of the PPI rates, while at the same time also implied a resilience of the demand side of the US economy, healthy economic activity for the manufacturing sector and a possible tightening of the US labour market. Hence we may see the Fed’s stance hardening despite market expectations for the bank to deliver another two rate cuts until the end of the year with the first cut being delivered in the September meeting. Yet at the same time we also note the adding pressure by US President Trump on Fed Chairman Powell for the bank’s monetary policy to ease. We highlight the speech of Fed Chairman Powell tomorrow and should he sound dovish enough we may see gold’s price gaining some support. Yet should the Fed Chairman sound prepared to keep rates high for longer we may see the release weighing on gold’s price.
- On a more technical level, we note that China’s gold purchases despite being continued, in the past month seem to have eased and have reached 63 metric tons. It’s the second month of China’s gold purchases being decreased after peaking in April. Should we see gold demand from China continuing to ease in the coming months we may see it weighing on gold’s price.
- On a last note and despite the potential easing of the market’s sensitivity to the issue, we note US President Trump’s trade wars as another factor that could move gold’s price. At the current stage market interest seems to revolve around the EU-US relationships, where a trade deal seems possible. It’s characteristic that US Trade Secretary Lutnick, stated that he is confident that a US-EU trade deal will be secured. Any thawing in the US trade relationships could weigh on gold’s price, as market worries could ease somewhat leading to safe haven outflows for the precious metal. On the other hand, US President Trump’s trade deadline on the 1st of August as indicated by Lutnick is a hard deadline, in turn intensifying the market worries which in turn may provide support for gold’s price.
Gold technical analysis
Since our last report we re-adjusted R1, S1 and the S2 to better reflect the boundaries within which the precious metal’s price has been moving. Gold’s price remained in a tight rangebound movement just below the 3375 (R1) resistance line.
The Bollinger bands narrowed implying less volatility for Gold’s price, while the RSI indicator edged higher yet remains close to the reading of 50, remaining unconvincing for the bullish intentions of the market for gold’s price.
Hence we maintain a bias for the sideways motion to continue at the current stage. For a bullish outlook to emerge we would require gold’s to break clearly the 3375 (R1) resistance line and start aiming for the 3500 (R2) resistance level, which is an All Time High level for gold’s price.
For a bearish outlook to be adopted, which is a more remote scenario at the current stage, we would require gold’s price to reverse direction, drop and break the 3250 (S1) support line, thus opening the gates for the 3120 (S2) support level.
XAU/USD Daily Chart
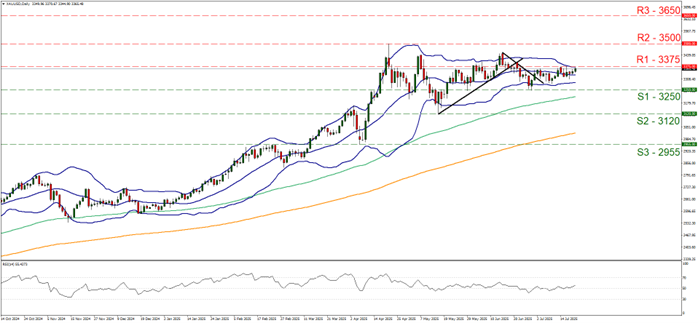
- Support: 3250 (S1), 3120 (S2), 2955 (S3)
- Resistance: 3375 (R1), 3500 (R2), 3650 (R3)


