
Since our last report gold’s bulls seemed to be hesitating on Thursday causing for a correction lower, yet renewed its bullish outlook the following day and during today’s Asian session reached All Time High levels. In the current report we are to have a look at the main issue of the past few days, namely the threats of US President Trump to slap more tariffs on Chinese products entering the US, have another look at the negative correlation of the USD with gold’s price and look at the calendar for events that could move gold’s price. The outlook is to be concluded with a technical analysis of gold’s daily chart.
- The main issue of the past few days was US President Trump’s threats last Friday, to impose 100% tariffs on US imports from China, “over and above any Tariff that they are currently paying,” starting on Nov. 1. US officials later including US President Trump downplayed the possible effects “Don’t worry about China, everything will be fine!” while also praising Chinese President Xi Jinping. The issue resembles more of a negotiating tactic yet there is always \ certain degree of uncertainty with US President Trump. In any case the issue was another indication of the fragile US-Sino negotiations and intensified the uncertainty in the markets and tended. Overall the issue seems to be feeding gold with safe haven inflows, hence should we see further escalation of the tensions in the US-Sino trading relationships, we may see gold’s price getting further support.
- An issue that we constantly tend to examine on our gold update is the negative correlation of the USD with gold’s price. In the past week we saw the USD index, which describes the relationship of the USD with a basket of other currencies, rising despite a weakening on Friday. Similarly Gold had a rising trajectory last week with a slipping on Thursday. So overall we see the two trading instruments moving on a parallel way. Hence we continue to view the negative correlation of gold with the USD as being inactive. We also note that the US bond yields fell sharply and across the board last Friday, in another indication of investor’s possible flight to safety. In any case lower yields tend to polish the shiny metal and further drop could provide support for gold’s price.
- Given that the release of US financial releases is to be postponed as the US Government shutdown is continued we shift our focus on Fed’s stance as a factor that could affect gold’s direction. We have a number of Fed policymakers schedule to speak next week with Fed Chairman Powell coming up on the calendar tomorrow. A quick reminder Fed policymakers seem to be split on the matter of how far the bank should ease its monetary policy. Fed policymakers such as Miran and Williams tend to be leaning more on the dovish side, while others such as Schmidt and Bostic tend to maintain their doubts, albeit Bostic seems to be rethinking his stance lately and may flip sides. Should we see more Fed Policymakers stressing the need for extensive easing of the Fed’s monetary policy we may see gold’s price getting some support and vice versa.
Gold technical analysis
The recent wobbling of Gold’s price gave us a chance to recalibrate our support and resistance lines. Despite a correction lower on Thursday, gold’s price continued to rise and is currently nearing the 4100 (R1) resistance line. For the time being we maintain a bullish outlook for gold’s price and we intend to keep it as long as the upward trendline incepted since the 22nd of august remains intact.
Furthermore we note that all moving averages on the chart are pointing upwards supporting our bullish outlook. Also the RSI indicator remains above the reading of 70, implying a strong bullish market sentiment for gold’s price, yet at the same time highlights that gold’s price is at overbought levels and may be ripe for a correction lower.
Hence, along with our bullish outlook we also issue a warning for a possible correction lower. Should the bulls maintain control over the precious metal’s direction, we may see it breaking the 4100 (R1) resistance line and start aiming for the 4300 (R2) resistance level.
Should the bears take over, we may see gold’s price dropping below the 3950 (S1) support line, continue to break the prementioned upward trendline in a first signal that the upward movement has been interrupted and continue to break the 3810 (S2) support line setting as the next possible target for the bears the 3630 (S3) support level.
XAU/USD Daily Chart
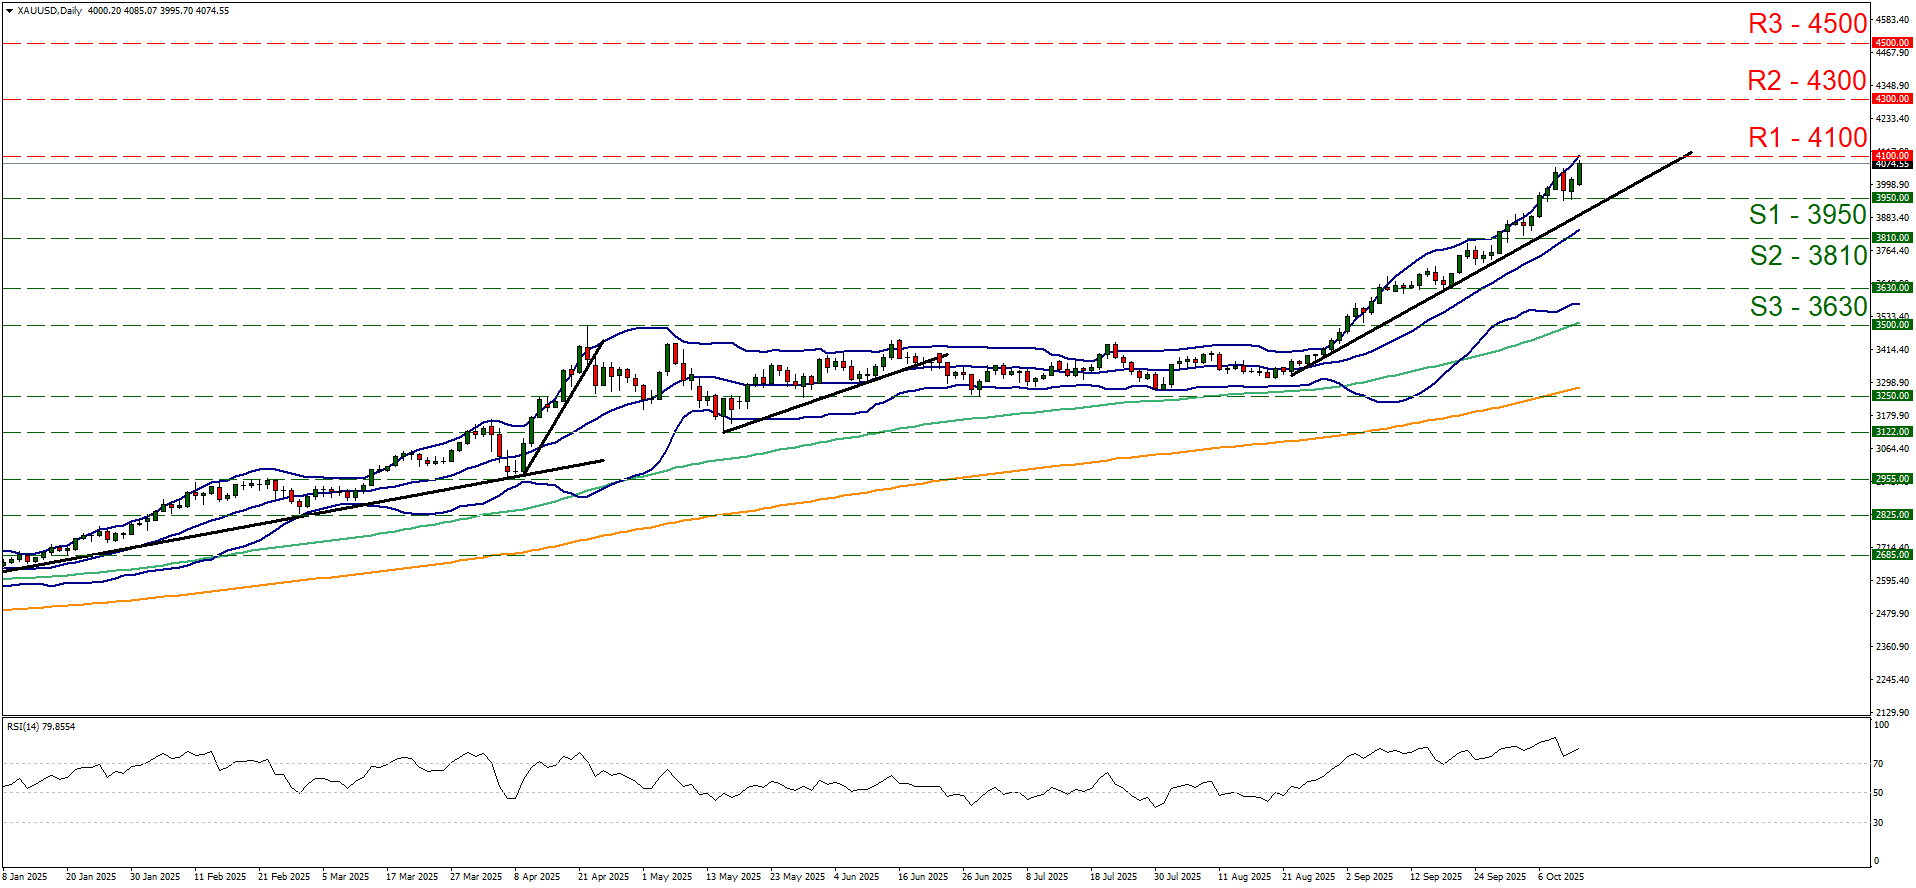
- Support: 3950 (S1), 3810 (S2), 3630 (S3)
- Resistance: 4100 (R1), 4300 (R2), 4500 (R3)


