
Strong demand for the shiny metal continues to roll in, pushing its price into fresh record highs week after week as investors flee towards safety amidst ongoing geopolitical turmoil. In this report we outline yet again the bullish catalysts aiding the bullion north, we draft a rough outlook on what to expect and we conclude with a technical analysis of gold’s daily chart.
- First things first, we begin with a theme that fed investors uncertainty constantly over the past few months, which is none other than the trade tensions between the world’s two largest economies, the United States and China. Boosting gold’s ascent during last week was the escalated, verbal, tensions between the two nations which clouded the prospects of peaceful coexistence and instead fuelled projections for a fragmentation of cooperation. Even though, tensions dissipated and order was somehow restored, albeit discontent from the US side regarding China’s export controls on rare earths, investors nonetheless, reassessed the possibility of another flare up between the two, which would escort risk-taking behaviour out the door and instead hurry in, bids for safe haven assets such as gold, supporting its climb into new uncharted territory.
- Another catalyst supporting gold’s prices last week was the temporary (for the time being) surfacing of credit worries from regional banks in the US, which made headlines last week and stoked fears for an imminent repeat of the mini banking crisis of 2023, when the Silicon Valley Bank collapsed. This time around, Zions Bancorp and First Brands disclosed multimillion dollar losses from real estate loans gone bad and challenged the credibility of the wider banking sector. Markets quickly, however, shook the worries off, branding the event as insignificant, distinguishing from the parallels drawn with SVB and carried on as usual. Credit default swaps remained relatively unchanged, signaling strong faith in US banks’ capitalization and reserves, maintaining the sector’s creditworthiness intact.
- Lastly, as the US government shutdown continues and the lack of economic data remains scarce, money markets hold onto their projections for the Federal Reserve’s future actions, foreseeing that a 25bps cut will come through in October (despite the lack of data), followed by another 25bps cut in December, for a total of 50bps of easing seen by years end. The extensive easing forecasts are adding another bullish tilt to the equation, providing support for the bullion, helping its ascent higher.
Gold technical analysis
Albeit the short-lived pullback last Friday, since order was restored between US-Sino tensions, the outlook for the bullion remains bullish, favoring the extension of the current uptrend onto new heights. We maintain our bullish outlook intact, since the upward trendline incepted since the 22nd of august remains intact and all moving average indicators track neatly the price action to higher ground.
The RSI indicator continues to trend above the 70 overbought level, showcasing strong bullish sentiment and momentum run the potential for faster price rises, yet at the same time highlights that gold’s price is at overbought levels and may be ripe for a correction lower.
Should the bulls maintain control over the precious metal’s direction, we may see it breaking the 4375 (R1) resistance line and start aiming for the 4500 (R2) resistance level. Should the bears take over, we may see gold’s price drop below the 4185 (S1) support line, possibly challenge the 4060 (S2) support zone continue downwards to challenge the aforementioned upward trendline, for a clear attempt at shifting the longstanding upward moving trend.
XAU/USD Daily Chart
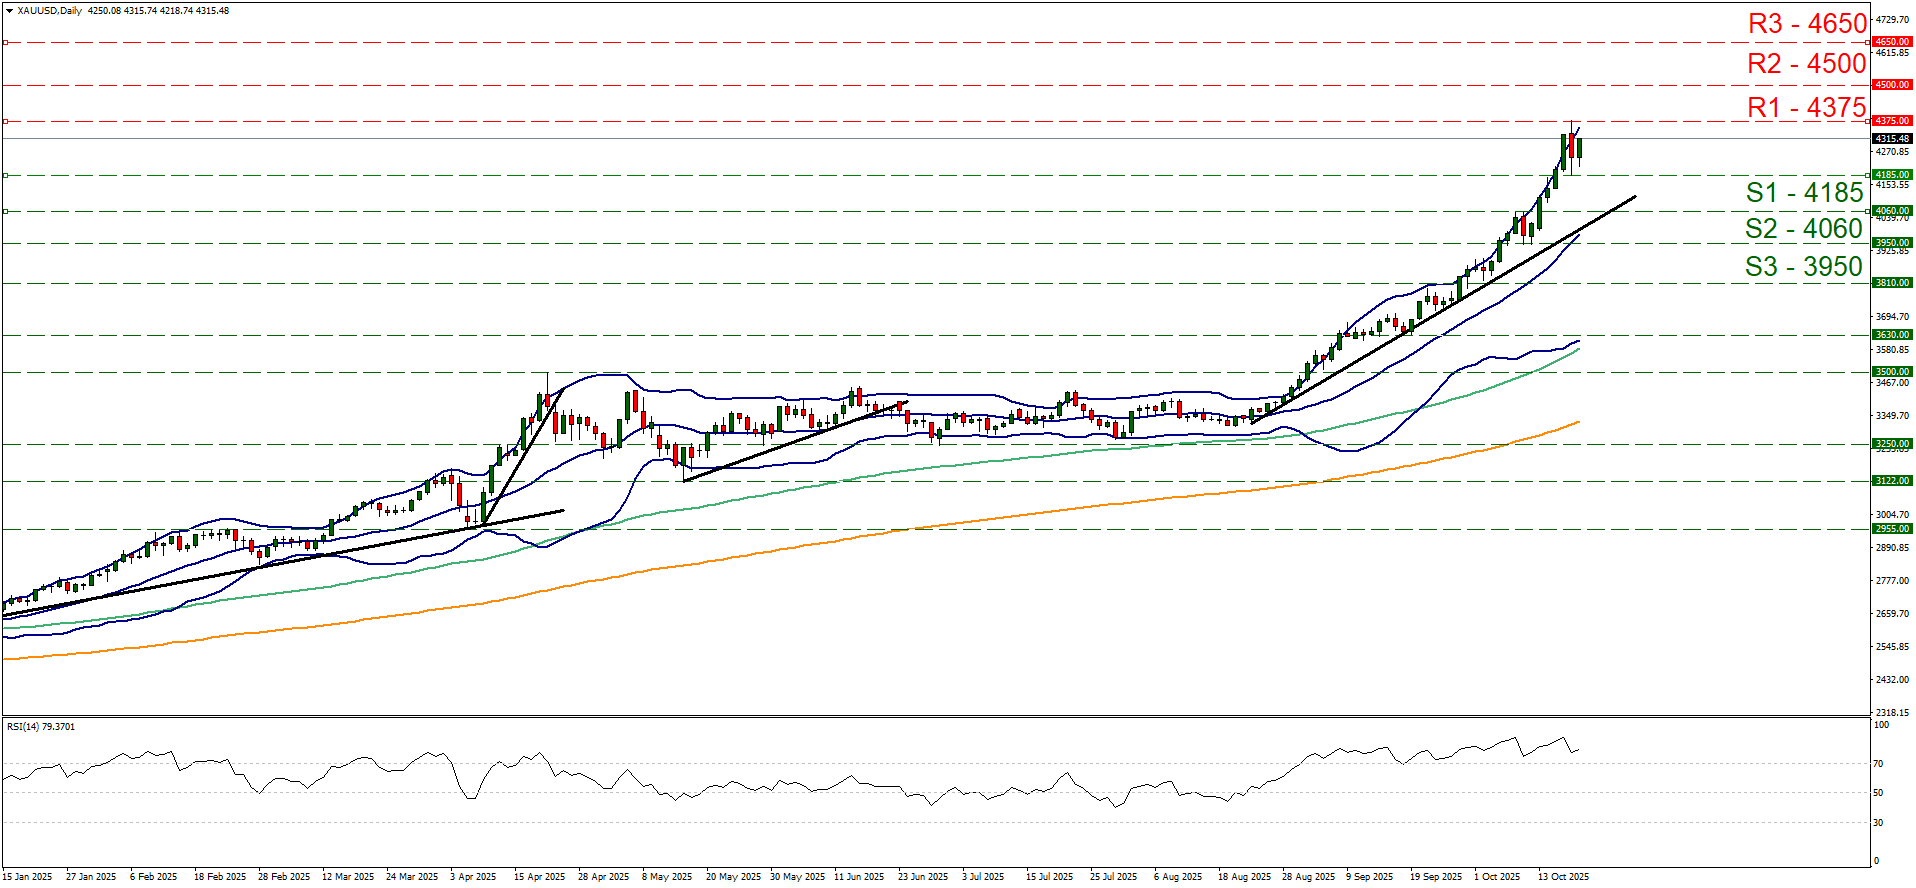
- Support: 4185 (S1), 4060 (S2), 3950 (S3)
- Resistance: 4375 (R1), 4500 (R2), 4650 (R3)


