
- Crude oil futures are currently attempting to rebound from 2-month lows around the $65 per barrel area, temporarily halting their five-day losing streak, as markets shift their attention towards geopolitical developments and the effect of Trump’s tariffs on the demand side of the commodity.
- President Trump ramped up threats towards nations that purchase crude from Russia, such as China and India, vowing to impose harsher tariffs hikes on them, giving a 3-week hiatus period before enforcement. Reportedly, Indian state-owner refiners are pulling back from purchases of Russian crude oil for now, seeking to comply and avoid being penalized.
- At the same time nonetheless, US and Russian delegations appear to be on the cusp of reaching a peace deal in Ukraine and traders now brace for a potential meeting between Trump and Putin, which could soften economic tensions between the two nations.
- US crude oil inventories data kept a check on prices or at least, capped their losing streak, with API reporting a 4.2-million barrels of drawdowns over the past week, surpassing market expectations of a 1.8-million-barrel draw, suggesting stronger-than-anticipated demand.
Technical Analysis of Oil
WTI Chart – Volatility around crude futures fade away, the commodity conducts balancing act near $65 per barrel area
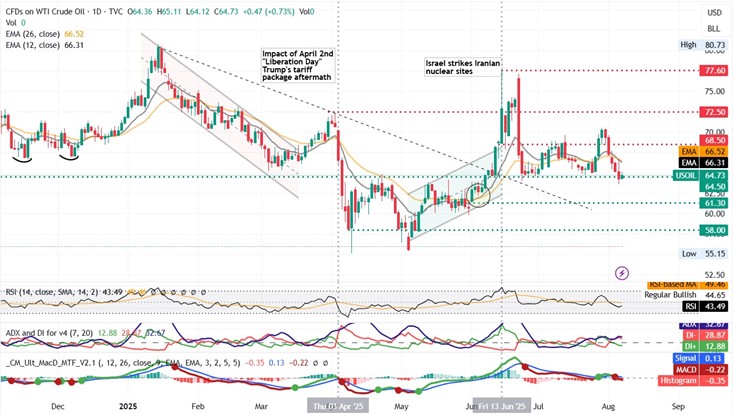
- Resistance: 68.50 (R1), 72.50 (R2), 77.60 (R3)
- Support: 64.50 (S1), 61.30 (S2), 58.00 (S3)
Another week goes by and WTI futures continue to gyrate aimlessly between the $64.50 (S1) and $68.50 (R1) per bounds, despite the 5-day losing streak, as traders scavenge for data to help them assess what may come next. Given the lack of catalysts and therefore volatility, we maintain our sideways bias for the commodity, projecting the extension of the move within the aforementioned bounds. Supporting our case is the RSI value of 46 signalling indecision but the +DI and -DI have moved slightly apart, with negative pressures somewhat persisting and ADX rising above 30.
Should the bulls take the initiative, we may see the commodity climbing above the $68.80 (R1) resistance level and after a successful break and head on to challenge the $72.50 (R2) area. Should the on the other hand the bears extend their reign, we would reasonably expect to see a break below, the closest line of defence at the $65.00 (S1) support level, and head south, towards the $61.30 (S2) support zone.


