Markets are increasingly growing anxious as to when will the harsh, “reciprocal” tariffs imposed by the Trump administration will strike the US consumer and inflate prices and consequently, how will the Federal Reserve respond with to such developments, in regards with their policy decisions.
So far, inflation in the US remained in stagflation mode and tariff effects have been broadly delayed (or rather non-existent), much like the finalization of the trade agreement between US and China, where negotiations received another extension, pushing the deadline forward by another 90 days.
The recent misstatement of the past quarter’s jobs data by the Bureau of Labor Statistics has given markets more conviction that rate cuts will begin in September and could be larger than originally projected
Given the 258k downward jobs revision, which showcased the cracks of the labour market, now traders hope a cooler than expected CPI print could do the trick and nudge the Fed to ease policy conditions.
However, according to today’s expectations, economists project that annual inflation in the United States most likely accelerated for the third straight month in July, climbing by a tenth of a percent to the 2.8% and likewise Core CPI, which excludes volatile food and energy prices, is seen rising also by a tenth of a percent to 3%. In the grander scheme of things, such readings won’t explicitly force the central bank to move quicker with cuts since they are broadly speaking, close to historical averages.
Moreover, significant deviations, such as an above-expectations rise of inflation to the 3.4%-3.5% in both the headline and core rates, will most likely make policymakers’ work harder, possibly forcing them to keep rates on hold amidst weaking labour market conditions, and money markets downsizing odds for both multiple, and larger rate cuts.
On the flip side, shall we observe a cooler-than-expected CPI print, odds for a 25bps rate cut in September will most likely solidify and traders will also upgrade the probabilities for follow up cuts in October and possibly December.
Technical Analysis
NASDAQ Chart – Nasdaq futures stand flat near record highs, ahead of critical July CPI print
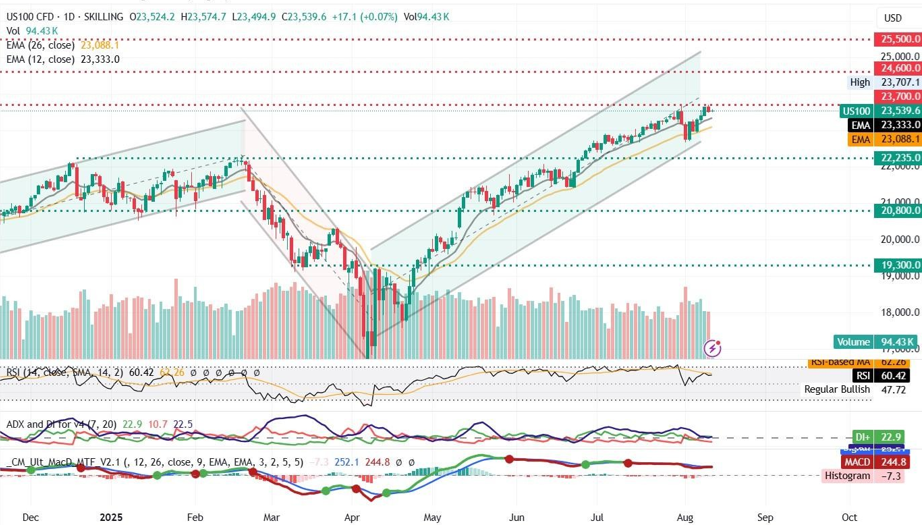
Resistance: 23700 (R1), 24600 (R2), 25500 (R3)
Support: 22235 (S1), 20800 (S2), 19300 (S3)


