Since last week’s update, gold’s price has edged higher, signaling a possible renewal of the bullish tendencies for the precious metal. In today’s report, we are to discuss the validity of the negative correlation of the USD with Gold, the market’s expectations for the Fed as well as geopolitical issues that could affect gold’s price. Besides the fundamentals, at the end of the report, we are to add also a technical analysis of gold’s daily chart, for a rounder view.
- Making a start by examining the validity of the negative correlation of the USD with Gold’s price, we note that the USD Index, which expresses the relationships of the greenback with a number of its counterparts, has been dropping over the past week, while gold’s price has been on the rise. Hence, we may say that the negative correlation of the two trading instruments is currently active, yet we note that the opposite movements may not be as symmetric with gold may benefit more from the weakening of the USD. Hence, despite a divergence on a quantitative level, the overall principle seems to have been activated and should we see the USD continue to weaken we may see gold’s price benefitting further.
- Furthermore, we note that US Bond yields seem to have started to edge higher, yet do not seem to be tempting gold traders to switch, at least not at the current stage. Yet should US bond yields rise materially, they may shift some of the attention from Gold towards US bonds as a safe haven investment destination. On the other hand, the market’s worries for the US economic outlook and the increased market expectations for the Fed to cut rates could keep interest in US bonds at lower levels.
- Also, we highlight the market’s expectations for the Fed’s intentions as may have been the key driver behind gold’s direction over the past week. The market as was mentioned in our last update, has switched its expectations and is currently expecting the Fed to proceed with a rate cut in its next meeting on December 10th. We note that the market expectations for the Fed to cut rates in ten days have intensified over the past week, providing further support for the shiny metal’s price. As the Fed’s meeting nears, we expect the market expectations to intensify further over the coming week.
- We also note that no Fed policymaker is expected to speak, given the bank’s moratorium of no statements, two weeks before the meeting, we turn our attention towards the release of the US PCE rates for September. A possible acceleration of the rates could imply a wider resilience of inflationary pressures in the US economy and thus add more pressure on the Fed to keep rates unchanged. Thus, an acceleration of the PCE rates could weigh on gold’s price, while a possible slowdown could provide a lift for gold’s price.
Also on a geopolitical level, we note that US diplomatic efforts for a peace deal in Ukraine are ongoing despite some resistance from the Ukrainians. The possible outcome of the efforts are highly uncertain yet should there be signals for a possible peace plan being accepted, we may see them weighing on gold’s price as market worries on a geopolitical level may ease. On the flip side tensions in Venezuela are escalating with the US directly now threatening the Maduro Government. Should we see tensions escalating further with a possible US military operation on the ground of Venezuela, we may see the price of gold getting some support as market worries may intensify further.
Gold technical analysis
Since our last update, gold’s price continued to rise and in today’s Asian session and European session, seems to have broken the 4240 (S1) resistance line, now turned to support and has reached levels not seen for the past six weeks. Hence, we switch our bias for a sideways motion of the precious metal in favour of a bullish outlook at the current stage. We also note that the RSI indicator has neared the reading of 70, implying a strengthening of the bullish market sentiment. Yet we also note that he precious metal’s price action has reached the upper Bollinger band which may slow down the bulls, if not cause a correction lower of gold’s price action.
Should the bulls maintain control over the gold’s price, we may see it aiming if not breaking the 4375 (R1) resistance line, which is an All Time High level for the bullion’s price, while even higher we note the 4500 (R2) resistance level as the next possible target for the bulls.
Should the bears take over, we may see gold’s price retreating, breaking the 4240 (S1) support line, continuing even lower to break also the 4130 (S2) support level, and then break the upward trendline, signalling an interruption of the upward motion, while even lower we note the 4000 (S3) support barrier.
XAU/USD Daily Chart
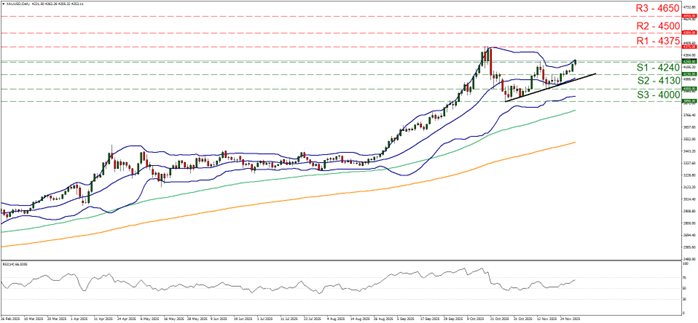
- Support: 4240 (S1), 4130 (S2), 4000 (S3)
- Resistance: 4375 (R1), 4500 (R2), 4650 (R3)