
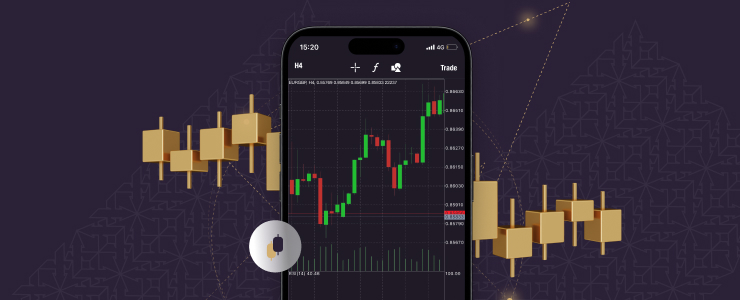
Understanding how technical indicators work in forex trading can transform your market analysis from guesswork into strategic decision-making. These mathematical calculations, derived from price and volume data, help traders identify potential entry and exit points in the volatile currency markets.
Understanding technical indicators in forex
Technical indicators are the backbone of forex market analysis. They transform raw price data into visual signals that traders can interpret quickly. Most indicators fall into four main categories: trend-following, momentum, volatility, and volume indicators.
Each type reveals different aspects of market behaviour and price movement patterns. Think of indicators as your trading compass. They don’t guarantee profits, but they provide direction when markets seem chaotic or unpredictable.
How technical indicators work in forex trading: The mathematics behind them
Every technical indicator relies on specific formulas applied to historical price data. The Relative Strength Index (RSI), for example, measures price change velocity and magnitude over fourteen periods. Moving averages smooth out price fluctuations by calculating average closing prices over set timeframes.
Removing emotional bias with indicators
A 50-period moving average adds up fifty closing prices and divides by fifty. This mathematical foundation ensures indicators remain objective. They eliminate emotional bias that often leads traders astray during volatile market conditions.

How technical indicators work in forex trading: Practical application
The real advantage of technical indicators comes from knowing how technical indicators work in forex trading in practice. Each indicator type serves specific analytical purposes. Trend indicators like moving averages help identify market direction. When price stays above the 200-day moving average, it suggests an uptrend continues. Momentum indicators reveal whether trends are strengthening or weakening. The MACD oscillator shows when momentum shifts might signal trend reversals.
Interpreting and combining indicators signals
Most traders make the mistake of treating indicator signals as absolute buy or sell commands. Smart analysis requires understanding what each signal actually means.
An RSI reading above 70 doesn’t automatically mean «sell immediately.» It indicates the currency pair might be overbought and due for a pullback. Combining multiple indicators provides stronger confirmation. When RSI shows overbought conditions and MACD begins declining, the sell signal becomes more reliable.
Popular technical indicators every forex trader should know
The forex market offers dozens of technical indicators, but mastering a few essential ones beats surface-level knowledge of many. Moving averages remain the most widely used indicators. The 50-day and 200-day moving averages help identify long-term trends and support/resistance levels. RSI measures momentum on a scale from 0 to 100. Values above 70 suggest overbought conditions, while readings below 30 indicate oversold markets.
How technical indicators work in forex trading: Using MACD for trend & momentum
MACD combines trend-following and momentum analysis in one indicator. It plots the difference between two exponential moving averages. When the MACD line crosses above the signal line, it generates bullish signals. Bearish signals occur when the MACD line drops below the signal line. The histogram shows the difference between MACD and signal lines. Growing histogram bars indicate strengthening momentum in the current direction.
Setting up technical indicators for maximum effectiveness
Proper indicator setup determines whether your analysis helps or hurts your trading performance. Default settings work for general analysis, but customization improves results. Most platforms default RSI to 14 periods, but shorter timeframes like 9 periods provide more sensitive signals for day trading. Longer periods like 21 reduce false signals but may lag behind rapid market changes. Test different settings on demo accounts before risking real money.
Optmising setup and avoiding common indicator mistakes
New traders often fall into the «more indicators equals better analysis» trap. Screen clutter leads to analysis paralysis and conflicting signals. Choose three to four complementary indicators maximum. One trend indicator, one momentum indicator, and one volatility measure provide comprehensive market coverage. Understanding how technical indicators work in forex trading means recognising their limitations. No indicator predicts future prices with perfect accuracy.
How technical indicators work in forex trading for stronger forex signals
Single indicators produce numerous false signals, especially during sideways markets. Combining indicators filters out weak signals and confirms strong ones. The classic combination pairs moving averages with RSI. When price breaks above the 50-day moving average and RSI exceeds 50, bullish momentum strengthens. Bollinger Bands work exceptionally well with RSI. When price touches the lower band and RSI shows oversold readings, bounces become more likely.
Creating your personal indicator setup
Successful traders develop signature indicator combinations that match their trading style and timeframes. Scalpers prefer faster indicators like stochastic oscillators.
Swing traders often combine daily moving averages with weekly MACD signals. This approach filters out market noise while capturing significant trends. Position traders might use monthly moving averages with quarterly momentum indicators. Longer timeframes reduce whipsaws and false breakouts.
Real-world application: Trading with technical indicators
Let’s examine how technical indicators work in forex trading using a practical EUR/USD example from recent market action. During March 2024, EUR/USD tested support near 1.0800 while RSI dropped to 25, indicating oversold conditions. The 50-day moving average provided additional support. Smart traders waited for confirmation. When RSI bounced above 30 and price closed above the previous day’s high, they entered long positions.
How technical indicators work in forex trading: Managing risk with indicators
Technical indicators help identify entry points, but risk management determines long-term success. Set stop losses below recent swing lows when buying oversold bounces.
Position sizing should reflect signal strength. Stronger signals from multiple confirming indicators justify larger position sizes within your risk tolerance. Take partial profits when RSI reaches overbought levels. This approach locks in gains while allowing remaining positions to capture extended moves.
Advanced strategies: How technical indicators work in forex trading
Experienced traders develop sophisticated approaches combining multiple timeframe analysis with technical indicators. Daily signals confirmed by weekly indicators produce higher-probability setups. Divergence analysis reveals when price and momentum move in opposite directions.
Hidden divergences often signal trend continuation, while regular divergences warn of potential reversals. Volume-based indicators like On-Balance Volume confirm price movements.
Rising prices with increasing volume suggest sustainable uptrends. Understanding how technical indicators work in forex trading extends beyond basic signal recognition. Professional traders use indicators to gauge market sentiment and identify institutional activity.
Choosing the right broker for forex technical analysis
Your broker’s trading platform directly impacts how technical indicators work in forex trading. Look for platforms offering comprehensive charting tools and customisable indicators.
Xlence provides access to over 80 currency pairs with professional-grade technical analysis tools. Their platform includes all major indicators plus advanced features like custom indicator programming. Reliable execution becomes crucial when acting on time-sensitive indicator signals.
Slippage and requotes can turn profitable setups into losing trades during volatile market conditions. Technical indicators transform forex trading from gambling into systematic analysis. Master the fundamentals, practice with demo accounts, and gradually develop your personal approach to reading market signals.
DISCLAIMER: This content is for general informational and educational purposes only and should not be considered investment advice or investment recommendation.