
Markets seem to hesitate as financial markets struggle to commit to a clear direction amid shifting geopolitical and macroeconomic signals.
Oil prices are stabilising after recent declines, as optimism around potential US–Iran ceasefire talks is balanced by ongoing supply-side risks and elevated uncertainty around key shipping routes. Meanwhile, US equities continue to push higher, supported by strong earnings and AI-driven optimism, even as overbought technical conditions hint at possible short-term corrections.
In FX, the USD shows signs of pausing its recent decline as traders weigh upcoming data releases and Fed commentary, while Bitcoin remains largely range-bound, reflecting a lack of strong new catalysts to drive momentum.
Oil prices weaken
Oil prices seem to have halted their drop in yesterday’s American and today’s Asian and European sessions. Overall the market seems to be hesitating about the prospect of a more permanent ceasefire deal in the US-Iran war.
On the one hand, reports for a breakthrough in the US-Iran negotiations and increased hopes for a ceasefire in Lebanon, tended to enhance the market’s optimism yet on the other hand the Straits of Hormuz are practically still closed, and the US blockade on Iranian ports tends to add more uncertainty for the markets.
Xlence Research Team opinion
Should we see market hopes for a ceasefire deal being enhanced, we may see fundamentals weighing once again on oil prices. On the flip side, should market worries be enhanced about a possible escalation in the conflict, we may see oil prices rising.
WTI H4 Chart
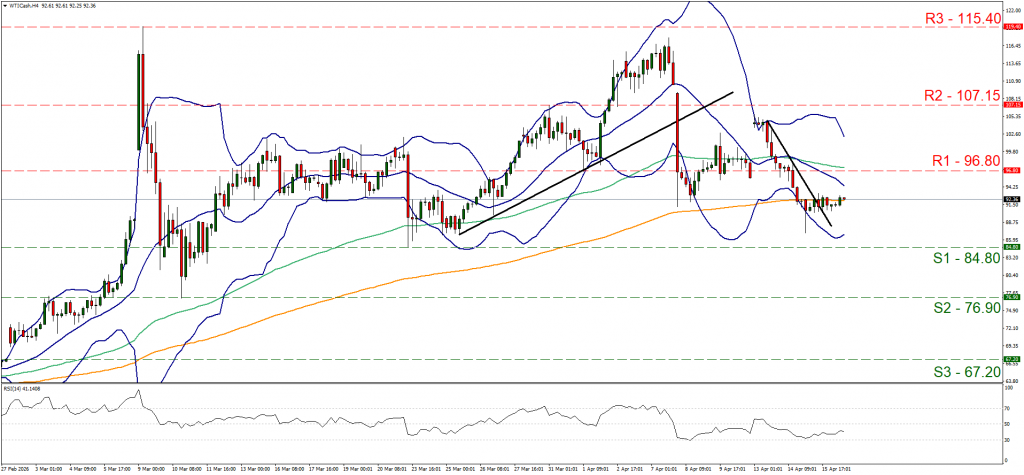
- Support: 84.80 (S1), 76.90 (S2), 67.20 (S3)
- Resistance: 96.80 (R1), 107.15 (R2), 115.40 (R3)
On a technical level, we note the stabilisation of the commodity’s price action in the past 24 hours. It should be noted that the downward trendline guiding WTI’s price action has been broken, hence we switch our bearish outlook in favour of a sideways motion bias for the time being.
Nevertheless we note that the RSI indicator remains steadily below the reading of 50, implying a bearish predisposition of the market for the commodity’s price. Should the bears regain the initiative for WTI’s price action,we may see it breaking the 84.80 (S1) support line and start aiming for the 76.90 (S2) support level. Should the bulls take over, we may see WTIs’ price rising and breaking the 96.80 (R1) resistance line and start aiming for the 107.15 (R2) resistance level.
US stock markets reach new record high levels
US stock markets remain confident with indexes like Nasdaq and S&P 500 reaching new record high levels. Increased market hopes for a possible ceasefire deal in the US-Iranian conflict may be forming the basis of the stock markets’ optimism, yet attention seems to be shifting partially to the earnings season.
TSMC’s optimistic forward guidance for an increase in revenue for a year implied the expectations for an increase in demand for semiconductors and a subsequent rise of the AI sector. Also the EPS and revenue figures reported in earnings reports of major US banks tended to largely exceed market expectations and tended to feed the market’s optimism.
Xlence Research Team opinion
On a fundamental level, we see the case for US stock markets to continue to rise under the prerequisites that market hopes for a ceasefire in the US-Iranian conflict intensify and earnings reports continue to report better than expected EPS and revenue figures as well as optimistic forward guidance.
US 100 Cash H4 Chart
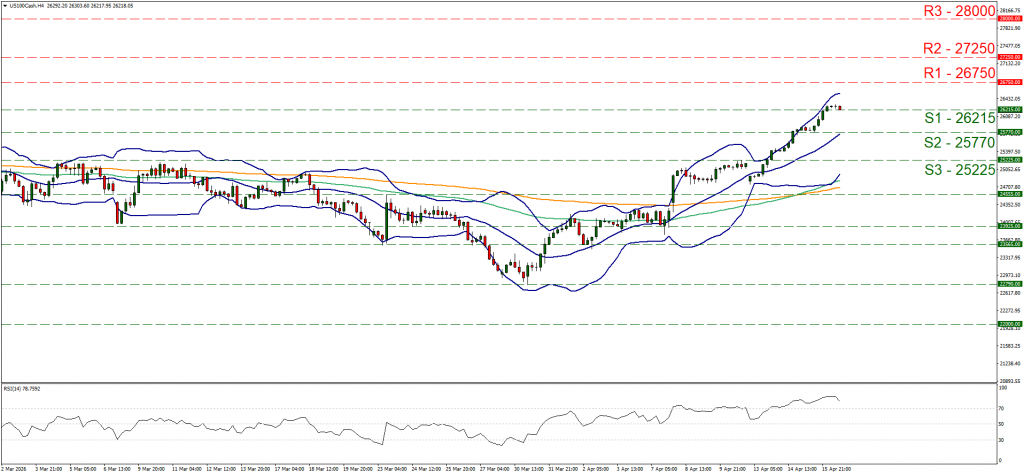
- Support: 26215 (S1), 25770 (S2), 25225 (S3)
- Resistance: 26750 (R1), 27250 (R2), 28000 (R3)
Nasdaq was on the rise yesterday and during today’s Asian session was able to reach new record high levels by breaking the 26215 (S1) resistance line, now turned to support. The RSI indicator despite correcting a bit lower, it remain at very high levels, higher than the reading of 70, implying that the index’s price action is at overbought levels and ripe for a correction lower.
We set as the next possible target for the bulls the 26750 (R1) resistance line. Should the bears take over, we may see Nasdaq’s price action breaking the 26215 (S1) support line and continuing lower by breaking also the 25770 (S2) support level.
USD bears seem to hesitate
In the FX market the USD seems to have halted its downward motion, at least temporarily. The USD’s safe haven status continues to be the main characteristic for its direction currently. Nevertheless we note the release of the US Philly Fed Business index for April which could affect the US should the figure released differ substantially from market expectations.
Also the Fed’s intentions could affect USD’s direction and we note Fed policymakers which are scheduled to speak today. Especially Fed Board Governor Miran, which is a well known dove, and could make statements that could weigh on the USD.
Xlence Research Team opinion
Should market hopes for a possible more permanent ceasefire deal in the US-Iran conflict, intensify we may see the USD losing ground as investors be prefer riskier assets. Also a possible disappointment of traders by financial releases could weigh on the USD as could substantially dovish comments by Fed policymakers. Should market worries for the US-Iran conflict intensify we may see the USD getting some support, while also better than expected figures from financial releases today could provide support for the USD.
EUR/USD H4 Chart
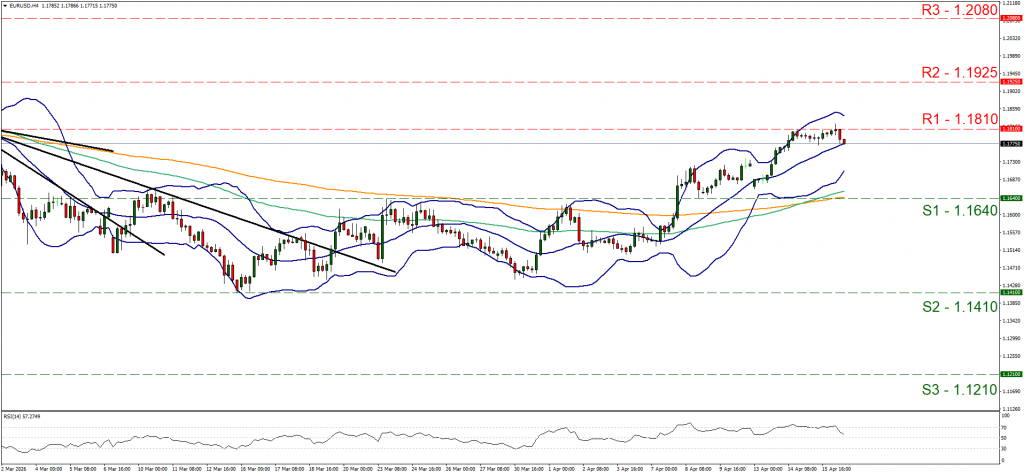
- Support: 1.1640 (S1), 1.1410 (S2), 1.1210 (S3)
- Resistance: 1.1810 (R1), 1.1925 (R2), 1.2080 (R3)
Over the past 48 hours EUR/USD tested twice the 1.1810 (R1) resistance line and failed to clearly break it. Also the RSI indicator corrected lower nearing the reading of 50 and implying an easing of the market’s bullish sentiment for the pair. For abandoning our sideways motion bias in favour of a bullish outlook we would require EUR/USD’s price action to break the 1.1810 (R1) resistance line and start aiming for the 1.1925 (R2) resistance level. For a bearish outlook, which we currently see as remote yet still possible given the difficulty of the pair to break the R1, we would require EUR/USD to reverse direction and break the 1.1640 (S1) support line and start aiming for the 1.1410 (S2) support level.
Bitcoin bulls seem unable to push the crypto higher
Bitcoin’s price seems to have stabilised in another signal of weakness on behalf of the demand side of the crypto market. We reiterate our cautiousness for Bitcoin’s upward potential at the current stage as expressed in yesterday’s report. Overall, Bitcoin seems to fail to capitalise on the improvement of the market’s sentiment in contrast to US stock markets.
Xlence Research Team opinion
For the time being, we maintain our expectations for the Bitcoin’s price action to remain relatively stable. It may take something fundamentally substantially positive and specific for the crypto market for Bitcoin’s price to rise. Also, possible substantially dovish comments by Fed policymakers could provide some support for Bitcoin’s price on a fundamental level.
BTC/USD H4 Chart
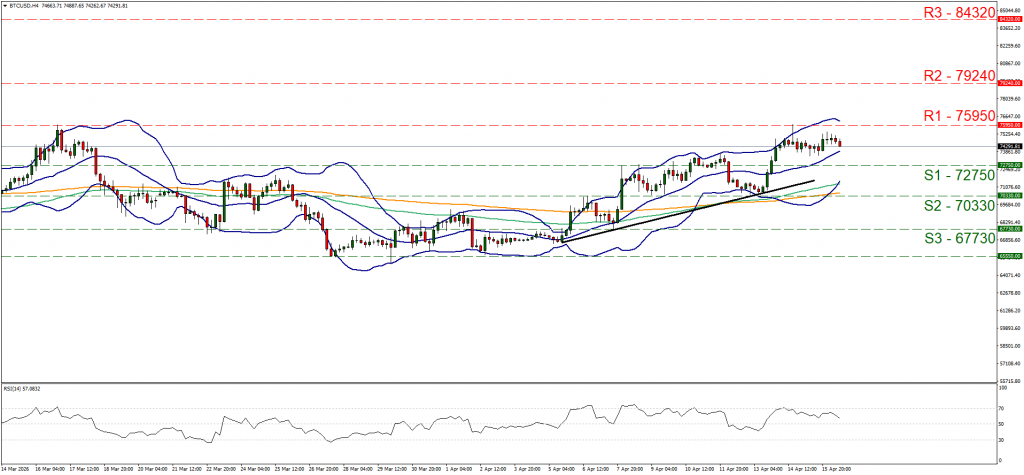
- Support: 72750 (S1), 70330 (S2), 67730 (S3)
- Resistance: 75950 (R1), 79240 (R2), 84320 (R3)
Bitcoin’s has remained stable over the past 48 hours. Despite at some point testing the 75950 (R1) resistance line, the crypto king’s price action remained largely between the 72750 (S1) and the 75950 (R1) levels. We maintain our bias for a sideways motion of Bitcoin’s price and note that the RSI indicator has lowered nearing the reading of 50.
The easing of the bullish market sentiment may allow Bitcoin’s price to remain in a sideways motion. Should the bulls take over ,we may see Bitcoin’s price breaking the 75950 (R1) resistance line and start aiming for the 79240 (R2) resistance level. Should the bears take over, we may see Bitcoin’s price dropping below the 72750 (S1) support line and start aiming for the 70330 (S2) support base.
Disclaimer: This information is not considered investment advice or an investment recommendation, but instead a marketing communication.