
- WTI futures somewhat stabilized around the $63 per barrel area over the past week, with volatility dissipating, as the panic selling stage of the Liberation Day announcement has been countered by robust technical dip-buying activity.
- On the demand front, market participants still struggle to assess global oil consumption for the year ahead, fixating upon the full-fledged trade war between the US and China, who are at the end of the day, the two largest global users of the energy commodity.
- So long the two superpowers continue to clash heads, fundamentals for crude are expected to lean on the bearish side, yet as the two traverse closer to “realistic” trade agreements, the overall negative effect shall be reasonably expected to dissipate.
- Evidently, a factor that may have contributed to the dissipation of erratic volatile moves this week, may have been the “de-escalatory” statements from President Trump, noting that tariffs on Chinese imports “won’t be anywhere near as high as 145%” and will come down substantially from that level.
- At the end of the day this move is designed to lure the Red Giant to the negotiating table, which is on paper a development that could support crude prices, should tensions between the two soften.
- Moreover, crude oil prices found support from speculations that OPEC+ may fast track its oil output for the second straight month, but no major announcement has yet taken place.
- On the flip side, Kazakhstan, a large member of the oil cartel, noted that it will prioritize its domestic interests and adjust accordingly its production levels, adding that it cannot slash output from its territorial fields as that would be too costly, raising concerns for internal tensions between members. The decision was frowned upon by the head of the pack, Saudi Arabia.
Technical Analysis of Oil
WTI Chart – Crude swings violently amidst tariff uncertainty
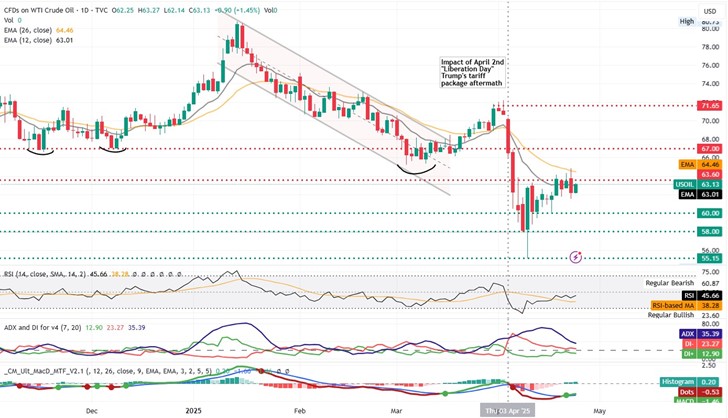
- Resistance: 63.60 (R1), 67.00 (R2), 71.65 (R3)
- Support: 60.00 (S1), 58.00 (S2), 55.15 (S3)
After a few tumultuous weeks filled with volatility, crude futures managed to consolidate close to the $63 per barrel area after a heavy dosage of technical dip buying activity. We continue to hold a bearish outlook bias for the commodity, merely on the fact that the overall negative sentiment around the commodity has been merely muted yet not strangled, but the recent consolidation this week entices us to consider switching our assessment, favoring the prolongment of the sideways price action in the short term.
Supporting the case for an extension of the towards the downside, is the failure of the price action at breaching the both the 12 and 26 EMA lines, alongside the respective failure of the RSI indicator crossing above the 50 threshold, which indicates that the sellers are still in control, with diminished strength. The ADX indicator conveys similar messaging, that the momentum of the bears waned, yet the selling strength prevails buying.
Should bearish sentiment reignite, we would reasonably expect to see WTI breaking below the $60 (S1) and challenging the $58.00 (S2) support area zone. Should the bulls find enough resolve and take over, we may see the commodity break above the $63.60 (R1) resistance level and move closer to the $67.00 (R2) resistance barrier, with the EMAs forming at the same time a golden cross indicating reversal of the short term trend.