
- Crude oil futures managed to extend their rebound earlier this week and reach their highest levels since April, as traders apprehended the de-escalatory negotiation deal between the world’s two largest superpowers with joy, refreshening their outlooks for higher consumption.
- The US-China trade talks concluded with a 90-day long truce to allow better calibration of their respective tariff proposals, agreeing at the same time to reduce the levies from 145% to 30% (US) and from 125% to 10% (China).
- Another factor that aided prices scaling higher was also the new round of US sanctions against Iranian oil, which brought the total of penalized Iranian shipping companies to 20.
- What is keeping prices from rising further however are expectations for a buildup of stock in US inventories from EIA this week, since yesterday the American Petroleum Institute reported an unusually large pileup in warehouses (4.28 million barrels) after last week’s drawdown (-4.49 million barrels), signalling shortcomings in demand for the energy commodity.
- Lastly, besides the weekly inventory count update, crude traders are expected to pay significant attention on OPEC’s monthly report, inbound later today, for a better assessment on the demand for the commodities in the foreseeable future.
Technical Analysis of Oil
WTI Chart – Negative momentum drives WTI prices closer to fresh 4 year lows
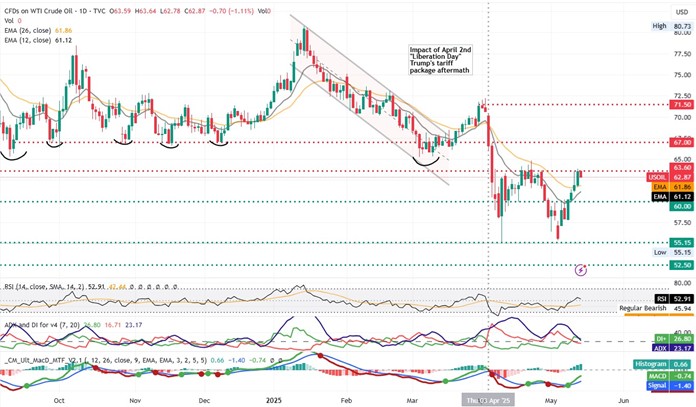
- Resistance: 63.60 (R1), 67.00 (R2), 71.50 (R3)
- Support: 60.00 (S1), 55.15 (S2), 52.50 (S3)
Earlier this week the bulls managed stay ahead and overpower the strength of the bears, aiding the commodity higher closer to tis former April highs. Given this move we are forced to alter our bias from bearish to sideways, albeit the recent rise in momentum in favour of the bulls, adopting a wait and see approach before switching entirely our assessment for a bullish case.
Supporting our case is the RSI indicator which registers a value of 53 indicating temporarily indecision and both the MACD and signal lines that remain below the threshold, showcasing that this week’s move may be just a corrective rebound. Should the bulls manage to keep price above both the 12 and 26 EMAs and maintain control over the direction, we would reasonably expect to see WTI breaking past the $63.60 (R1) resistance level and climb towards the $67.00 (R2) resistance barrier.
Should on the other hand, bullish momentum wear out and the bears regain control, we may see the commodity snap below the $60.00 (S1) support base that formerly acted as resistance, and the price action heading near the $55.15 (S2) base.


