- USD/CAD may test its primary barrier at the psychological level of 1.4000.
- The 14-day Relative Strength Index remains above the 50 mark, indicating that bullish bias is in play.
- The immediate support lies at the ascending channel’s lower boundary around 1.3980.
USD/CAD moves little after two days of losses, trading around 1.3990 during the early European hours on Thursday. The technical analysis of the daily chart suggests a weakening of a prevailing bullish bias as the pair is attempting to break below the ascending channel pattern.
The short-term price momentum has turned weaker as the USD/CAD pair moved below the nine-day Exponential Moving Average (EMA). However, the 14-day Relative Strength Index (RSI) is still positioned above the 50 level, suggesting that the bullish bias is still stronger.
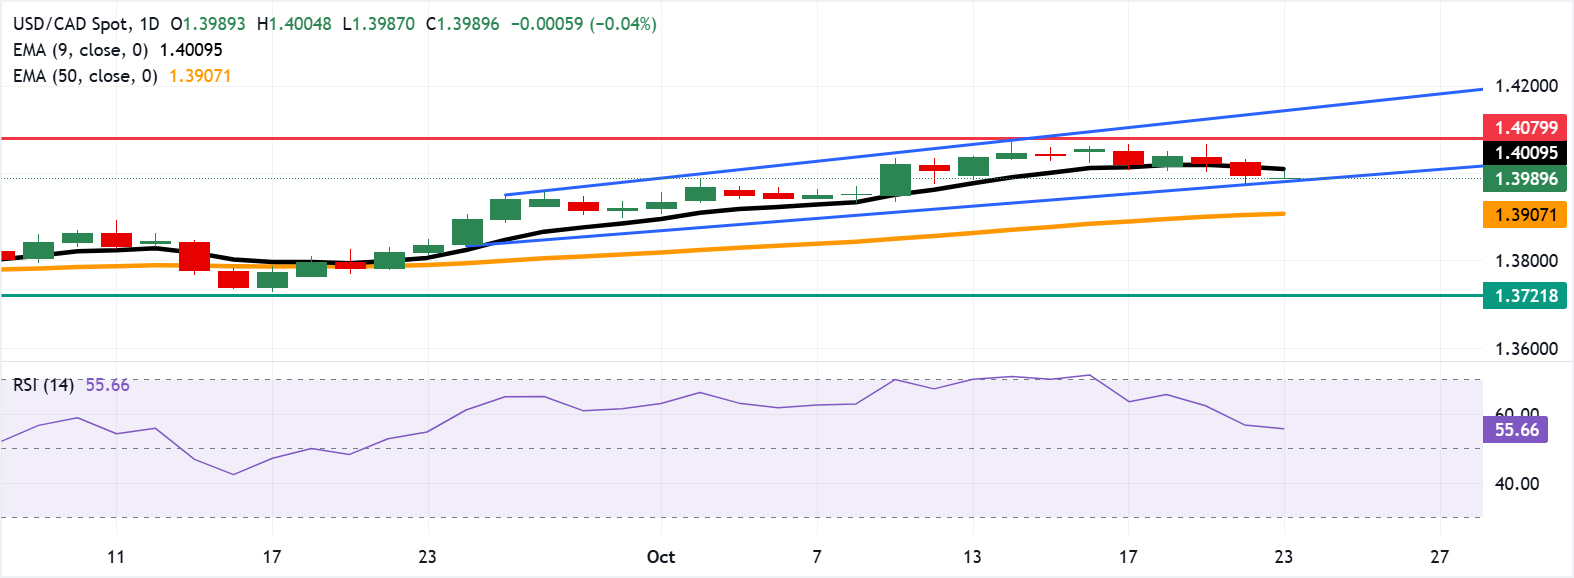
On the upside, the initial resistance appears at the psychological level of 1.4000, followed by the nine-day EMA of 1.4009. A break above this level would improve the short-term price momentum and prompt the USD/CAD pair to approach the six-month high of 1.4079, reached on October 14. A break above this level would support the pair to explore the region around the ascending channel’s upper boundary at 1.4140.
The USD/CAD pair is testing its immediate support at the ascending channel’s lower boundary around 1.3980. A break below the channel would weaken the bullish bias and put downward pressure on the pair to test the 50-day EMA at 1.3907. Further declines would dampen the medium-term price momentum and lead the pair to navigate the region around the three-month low of 1.3721.
USD/CAD: Daily Chart
Canadian Dollar Price Today
The table below shows the percentage change of Canadian Dollar (CAD) against listed major currencies today. Canadian Dollar was the strongest against the Japanese Yen.
| USD | EUR | GBP | JPY | CAD | AUD | NZD | CHF | |
|---|---|---|---|---|---|---|---|---|
| USD | 0.12% | 0.05% | 0.30% | -0.04% | -0.23% | -0.09% | 0.20% | |
| EUR | -0.12% | -0.06% | 0.19% | -0.17% | -0.34% | -0.21% | 0.08% | |
| GBP | -0.05% | 0.06% | 0.24% | -0.08% | -0.28% | -0.15% | 0.15% | |
| JPY | -0.30% | -0.19% | -0.24% | -0.34% | -0.53% | -0.42% | -0.10% | |
| CAD | 0.04% | 0.17% | 0.08% | 0.34% | -0.18% | -0.05% | 0.26% | |
| AUD | 0.23% | 0.34% | 0.28% | 0.53% | 0.18% | 0.14% | 0.42% | |
| NZD | 0.09% | 0.21% | 0.15% | 0.42% | 0.05% | -0.14% | 0.30% | |
| CHF | -0.20% | -0.08% | -0.15% | 0.10% | -0.26% | -0.42% | -0.30% |
The heat map shows percentage changes of major currencies against each other. The base currency is picked from the left column, while the quote currency is picked from the top row. For example, if you pick the Canadian Dollar from the left column and move along the horizontal line to the US Dollar, the percentage change displayed in the box will represent CAD (base)/USD (quote).