
- As tensions between Israel-Iran practically dissipated since the truce declaration, markets look elsewhere for clues about the trajectory of the commodity. Even though Iran has terminated cooperations with IEAE, the international energy body responsible for inspections on nuclear facilities, crude traders responded moderately towards the announcement since no actual supply disruption has taken place in any of the Middle Eastern nation’s oil refineries and depot facilities.
- In traders’ radars now blips the upcoming OPEC and non-OPEC Ministerial Meeting which take place this Sunday the 6th of July, where crude traders will be eager to hear the plans of the oil cartel in regarding their oil output quotas for August.
- Forecasters anticipate that the cartel will most likely increase its oil supply contribution further in August, raising its production by 411k barrels per day raising the total output number to 1.78 million barrels, resulting to a possible oversupply of the global oil market and artificially pressuring crude prices lower.
- In the US, the latest data from EIA inventories highlighted loss of demand for domestic consumption given the surprise pileup of 3.84 million barrels in stocks over the past week and marked the first buildup in stocks after 5 consecutive weeks of drawdowns. API stockpile data also recorded a rise in inventories, albeit with a smaller degree.
Technical Analysis of Oil
WTI Chart – Crude futures remain directionless around the $66 per barrel area ahead of OPEC meeting
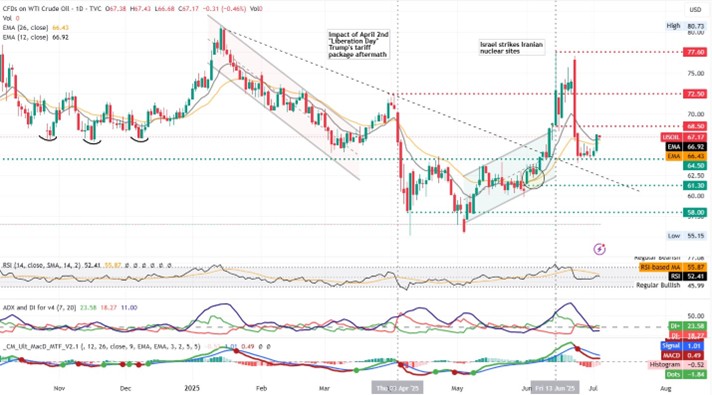
- Resistance: 68.50 (R1), 72.50 (R2), 77.60 (R3)
- Support: 64.50 (S1), 61.30 (S2), 58.00 (S3)
WTI futures remain rangebound between the $64.5 (S1) and $68.50 (R1) per barrel, since our last report, area as traders await in anticipation for the commentary of the OPEC meeting inbound on Sunday. Given the lack of catalysts and therefore volatility, we maintain our sideways bias for the commodity, projecting the extension of the move within the aforementioned bounds. Supporting our case is the RSI value of 52 signalling indecision and the merging of the +DI and -DI, showcasing buying and selling pressures neutralizing each other, in tandem with a suppressed ADX. Should the bulls take the initiative, we may see the commodity climbing above the $68.80 (R1) resistance level and after a successful break and head on to challenge the $77.50 (R2) area. Should the on the other hand the bears take over, we would reasonably expect to see a break below, the closest line of defence at the $65.00 (S1) support level, and head south, towards the $61.30 (S2) support zone.


