
In today’s report, we are to discuss the main fundamental issues surrounding gold’s price as well as any financial releases that could affect its direction and conclude the report with gold’s daily chart.
Revival of USD’s and gold’s negative correlation?
The fact that gold’s price corrected lower on Friday, while the USD edged higher tended to imply that the negative correlation of the two trading instruments may have been in play. Without rejecting the idea about Friday we have to note that it does not apply for the rest of the days of the past week. Hence we do not see in the current stage that negative correlation leading the price of gold.
On the flip side, US bond yields were allowed to descend lower since our last report and rise again, which may have faded gold’s shine, given the antagonistic relationships of gold with US Bonds in the international markets. So, should we see US yields continuing to rise over the coming week, possibly in a steeper fashion than what the market may be anticipating, we may see them weighing on gold’s price.
The release of the PCE rates and Fed’s stance could affect gold’s price
Since our last report we note the release of the Fed’s interest rate decision. The bank as was widely expected kept rates unchanged and seems to accept that more rate cuts will be necessary until the end of the year, as per the new dot plot. Yet on the other hand, the bank seems in no hurry to cut rates which highlights its doubts about extensive easing of its monetary policy. It also cut its growth forecast for the US economy while at the same time enhanced its inflation expectations allowing for stagflation concerns to emerge.
Should we see the market’s dovish expectations for the Fed intensifying in the coming week we may see them supporting gold’s price while a possible easing of the markets’ dovish expectations could weigh on gold. Hence we highlight the release of March’s PCE rates on Friday, which is the Fed’s favorite inflation metric at a core level. A possible acceleration of the rates could imply a persistence of inflationary pressures and thus ease market worries for the Fed to ease its monetary policy, weighing possibly on gold’s price.
Trump’s tariffs plans, to become flexible?
Media highlighted yesterday that US President Trump may be prepared to show some flexibility on the tariffs that he plans to apply of goods entering the US. The US President had signaled April 2nd as a date where most if not all of his planned tariffs are to come into effect. US Government officials seem to show some hesitation as to whether the planned tariffs are to be applied as initially planned at that date, a scenario that tends to ease market worries somewhat, thus taking safe haven flows away from the precious metal.
Technical analysis
On a technical level, we note since our last report we recalibrated gold’s daily chart. We note that gold’s price corrected lower yesterday, after hitting a ceiling at the 3050 (R1) resistance line. Despite the correction lower, we maintain our bullish outlook for the precious metal and we intend to maintain it as long as the upward trendline incepted since the 30th of December remains intact. We note that the RSI indicator despite correcting lower remains just below the reading of 70, implying that the bullish sentiment among market participants for the shiny metal is still present.
Furthermore, we also note that the price of gold corrected lower after a continuous flirting with the upper Bollinger band and the fact that the price action in its correction lower has created some distance from the upper Bollinger band tends to imply that the bulls have room to play, should they wish so. Should the bulls maintain control over gold’s price as expected we expect it to break the 3050 (R1) resistance line that also marks a record high level for the precious metal’s price and set as the next possible target for gold bulls the 3150 (R2) resistance level.
In the opposite direction a bearish outlook currently seems remote for the time being and for its adoption we would require gold’s price action to break the 2955 (S1) support line, continue to break the upward trendline incepted since the 31st of December, in a first clear signal that the upward motion has been interrupted and continue even lower to aim if not breach also the 2832 (S2) support level.
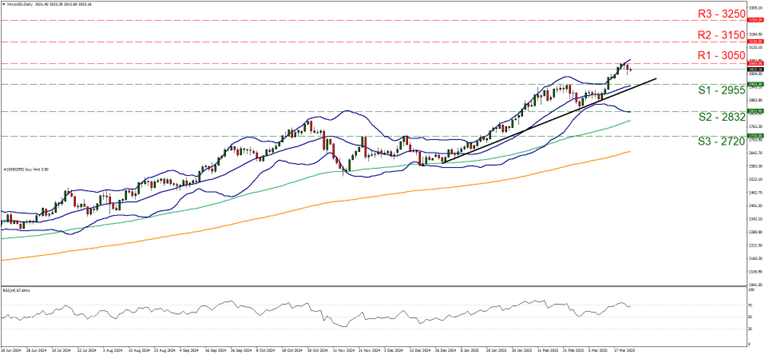
- Support: 2955 (S1), 2832 (S2), 2720 (S3)
- Resistance: 3050 (R1), 3150 (R2), 3250 (R3)


