
US President Trump’s tariffs are still creating mayhem in the markets with gold’s price opening with a negative gap today. Today we are to have a look at the fundamentals surrounding the precious metal and close the report with a technical analysis of gold’s daily chart.
- Analysts highlighted the possibility of a revival of the negative correlation of gold with USD as the tumbling of gold’s price on Friday coincided with a rally of the USD. Yet should one examine the movements of the two trading instruments over the past week on a day by day basis, it becomes obvious that the two trading instruments moved independently. Thus one should have a look for fundamental reasons behind gold’s movement elsewhere.
- At the same time we also note the tumbling of US bond yields also does not provide reasons that US bonds tend to provide a more attractive alternative to gold for international investors. Hence the course of US bond yields are also not an issue for gold at the current stage.
- Safe haven inflows could be an issue in the coming week for gold’s price, as should we see market uncertainty for the trade war intensifying, we may see gold’s price getting some support and vice versa, a possible cooling of the market’s uncertainty could create outflows for the precious metal.
- On the other hand we note that gold buying was continued in the past month by China’s PBoC for a fifth month in a row, in an indication of continuous interest in gold purchases by central banks. Should this tendency be maintained in April we expect it play a supportive role for gold’s price.
- In the current week we highlight the release of the CPI rates for March as a possible test for gold’s price. A possible acceleration of the rates could weigh on the yellow metal’s price and vice versa, yet it’s quite possible that the turbulence in the markets may overshadow the release.
- In the long term, the rising possibility of a recession in the US and elsewhere, a weaker dollar, lower yields and should the market await rate cuts in a greater extent and with greater anticipation, could all provide support for the precious metals’ price.
Technical analysis
On a technical level, we highlight the drop of gold’s price on Thursday and Friday breaking the 3050 (R1) support line, now turned to resistance. Yet the shiny metal’s price action failed to break the upward trendline guiding since the end of the past year, on the contrary it bounced on it, verifying its validity for the time being, yet the price action has still to make a higher peak in order for the upward motion to be maintained.
We also note that the RSI indicator has dropped substantially yet failed to break below the level of 50, which implies that the bullish market sentiment for gold’s price has been erased yet a bearish outlook has not been developed yet. Hence a stabilisation for gold’s price may be prevailing but for the time being we treat Friday’s drop as a correction lower.
For a bearish outlook, we would require gold’s price action to break initially the upward trendline incepted since the 31st of December, in a first clear signal that the upward motion has been interrupted, and continue to also break the 2955 (S1) support line and paving the way for the 2832 (S2) support level. Should the bulls renew their control over gold’s price, we may see the yellow metal’s price to break the 3050 (R1) resistance line that also marks a record high level for the precious metal’s price and set as the next possible target for gold bulls the 3150 (R2) resistance level, which is the latest record high level for the precious metal.
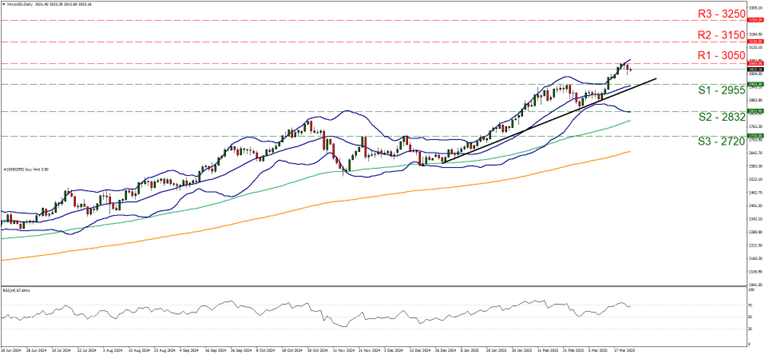
- Support: 2955 (S1), 2832 (S2), 2720 (S3)
- Resistance: 3050 (R1), 3150 (R2), 3250 (R3)


