Improved market sentiment remained in place across global markets, as investors continued to price in the possibility of a US-Iran ceasefire agreement. This optimism has reduced immediate fears of prolonged supply disruptions, weighing on oil prices while supporting risk-on flows into equities and higher-yielding currencies. At the same time, the USD continues to lose ground as safe-haven demand fades, while Bitcoin struggles to build stronger upside momentum amid still-muted buying interest.
Oil prices weaken
Oil prices renewed their downward motion in yesterday’s American session. On a fundamental level, the market’s hopes for a possible US-Iran ceasefire deal continue to weigh on oil prices. It should be noted that the US has stated that it has completely stopped trade to or from Iran. The market’s hopes may have been enhanced also by statements of US President Trump, who pointed towards the US-Iranian negotiations, raising optimism by stating « I think you’re going to be watching an amazing two days ahead ».
Xlence Research Team opinion
The market seems to see past the current oil crisis and the war in Iran, placing its bets on the scenario of a ceasefire deal being reached, despite any possible difficulties. Overall we see the case for a continuance of bearish pressures on oil prices, on a fundamental level.
WTI H4 Chart
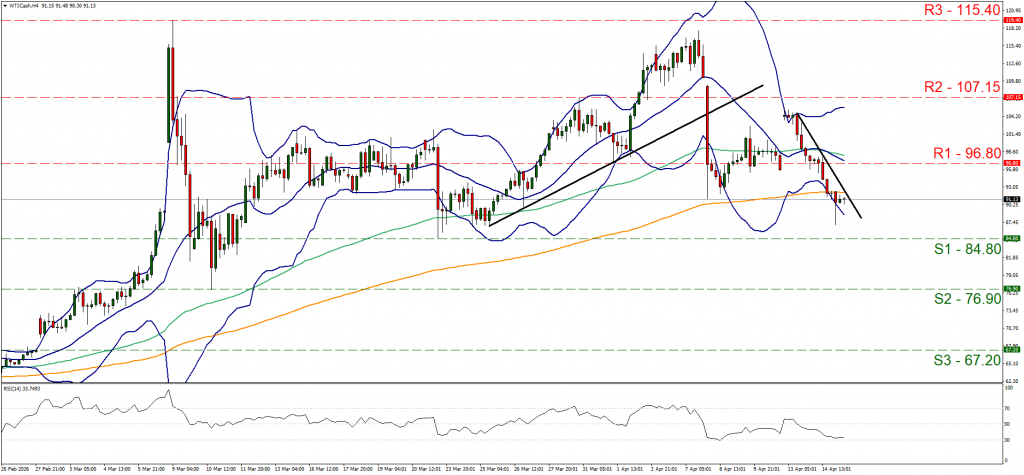
- Support: 84.80 (S1), 76.90 (S2), 67.20 (S3)
- Resistance: 96.80 (R1), 107.15 (R2), 115.40 (R3)
The stabilisation of WTI’s price action yesterday proved to be temporary and the commodity’s price action took another dive breaking the 96.80 (R1) support line now turned to resistance. We abandon our bias for a sideways motion and adopt a bearish outlook for the WTI’s price action. An upward potential for oil prices could be revealed should the market realise that the worst is still to come for the supply side of the international oil market.
USD continues to lose ground
The greenback continued to slip lower yesterday and during today’s Asian and early European sessions. AS mentioned in yesterday’s report given the improvement off the market sentiment, USD’s safe haven status tends to weigh on its price in the FX market. It should be noted that the weakening of the USD is evident across the board, implying a wider weakening of the USD. It’s also characteristic that the USD has reached a six week low point.
Xlence Research Team opinion
We tend to maintain a bearish outlook for the USD on a fundamental level, as long as the market sentiment remains in a risk on mood. Yet we also note that the USD may be affected on a fundamental basis also by the Fed’s hawkishness and should it exceed market expectations, we may see the USD getting some support.
AUD/USD H4 Chart
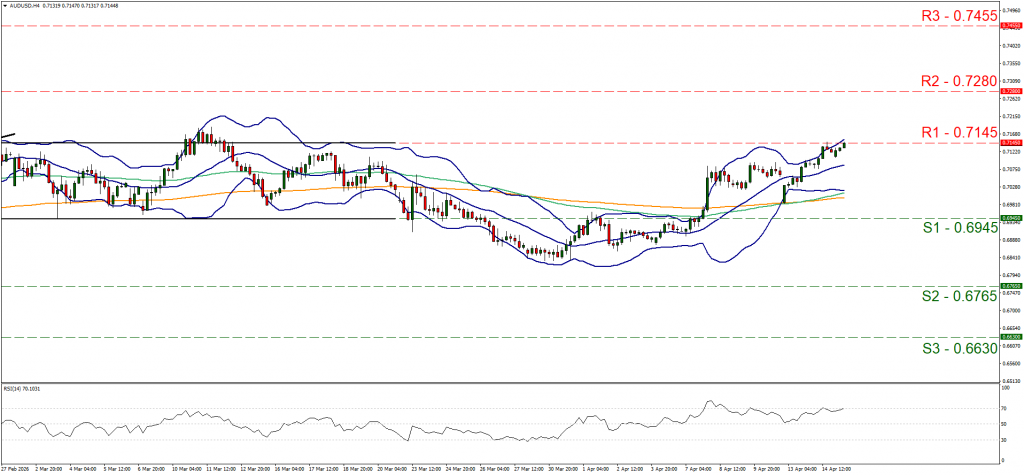
- Support: 0.6945 (S1), 0.6765 (S2), 0.6630 (S3)
- Resistance: 0.7145 (R1), 0.7280 (R2), 0.7455 (R3)
On a technical level, we focus on AUD/USD given that the release of Australia’s March employment data in tomorrow’s Asian session, could shake the pair’s price action. For the time being we note the pair’s upward motion since the start of the week. We tend to maintain a bullish outlook for the pair, yet we also note the pair’s difficulty to break the 0.7145 (R1) resistance line.
We also note that the pair may be nearing overbought levels and ripe for a correction lower. Should the bulls maintain control over the pair we may see AUD/USD breaking the 0.7145 (R1) resistance line and start aiming for the 0.7280 (R2) resistance level. For a bearish outlook we would require AUD/USD to reverse the gains made and break the 0.6945 (S1) support line taking in its sights the 0.6765 (S2) support level.
US stock markets seem to remain confident
US stock markets continued to rise yesterday albeit we buying appetite of investors seems to have been dented in today’s Asian and European sessions. We continue to view the war in Iran as the main factor behind the direction of US stock markets as the improvement of the market sentiment was largely induced by the market’s hopes for a possible US-Iranian ceasefire deal. Also we note the Feds’ intentions as a possible market mover for US stock markets. Last but not least let’s not forget that the earnings season is also creating headlines.
Xlence Research Team opinion
Should market hopes for a possible US-Iranian ceasefire deal be enhanced we may see US stock markets renew their bullish tendencies. Also better than expected earnings reports could provide support for US stock markets, while a possibly painful reminder of the Fed’s hawkishness could weigh on US stock markets.
US 500 Cash H4 Chart
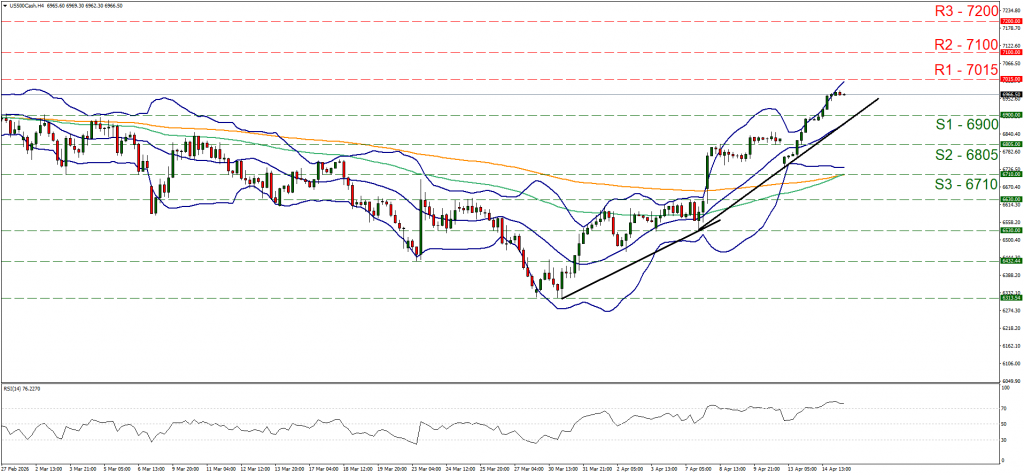
- Support: 6900 (S1), 6805 (S2), 6710 (S3)
- Resistance: 7015 (R1), 7100 (R2), 7200 (R3)
On a technical level, S&P 500 continued to rise yesterday breaking the 6900 (S1) resistance line, now turned to support. We tend to maintain a bullish outlook for the index, yet at the same time we note a relative taming of the bulls which could lead to some stabilisation of the index’s price action. The RSI indicator has surpassed the reading of 70, implying a strong bullish market sentiment for the index, and at the same time, highlights that the index’s price action is at overbought levels and ripe for a possible correction lower. Should the bulls maintain control as expected, we may see the index breaking the 7015 (R1) resistance line and start aiming for the 7100 (R2) resistance area.
Is Bitcoin’s rise too weak?
Bitcoin seems to have gotten some further support yesterday, as the improvement of the market sentiment tends to create tailwinds for the crypto king. Yet demand seems to remain lukewarm which tends to cap any gains for Bitcoin’s price. We tend to maintain a relative cautious approach on a fundamental level for the cryptocurrency as it may not have yet escaped the barriers of the selling cycle.
Xlence Research Team opinion
On a fundamental level we expect the market’s mood to be the main catalyst behind Bitcoin’s direction, given the cryptocurrency’s riskier nature. Should the market mood maintain a risk on approach, we may see Bitcoin’s price continuing to rise, while a possible cautious approach by the market, we may see Bitcoin’s price being on the retreat.
BTC/USD H4 Chart
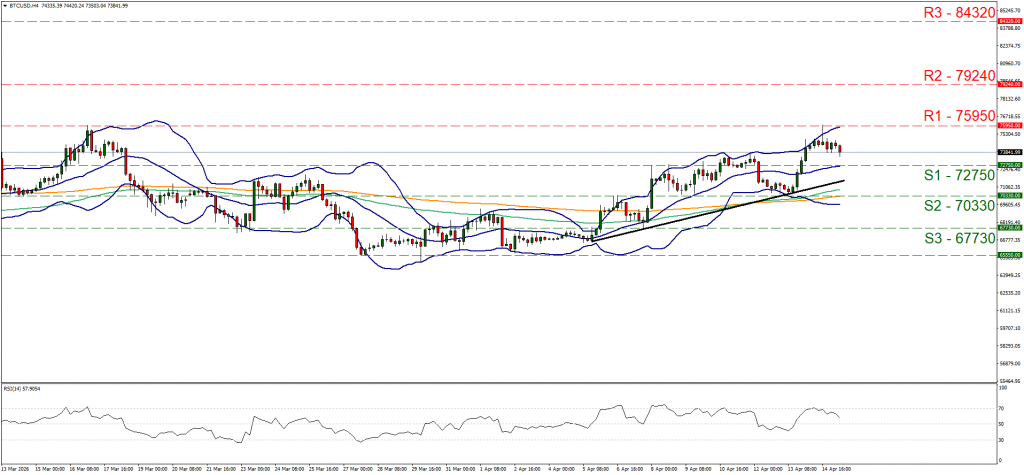
- Support: 72750 (S1), 70330 (S2), 67730 (S3)
- Resistance: 75950 (R1), 79240 (R2), 84320 (R3)
Despite BTC/USDat some point testing the 75950 (R1) resistance line yesterday, Bitcoin’s price action remained relatively stable. The RSI indicator retreated nearing the reading of 50, implying a possible easing of the bullish market sentiment for Bitcoin. The price action of Bitcoin, seems to remain contained between the R1 and the S1 for the time being. For a bullish outlook Bitcoin’s price has to break the 75950 (R1) resistance line and start aiming for the 79240 (R2) resistance level. For a bearish outlook, we would require Bitcoin’s price to break the 72750 (S1) support line and start aiming for the 70330 (S2) support base.
Disclaimer: This information is not considered investment advice or an investment recommendation, but instead a marketing communication.