
Market worries rise again as the USD opened higher in today’s Asian session, supported by renewed safe-haven inflows following concerns of a possible escalation in the US-Iran conflict.
However, the greenback later corrected lower against its FX peers, suggesting the initial move may have been an overreaction.
Markets now shift focus to Canada’s March CPI release and New Zealand’s Q1 2026 CPI data, while the GBP may attract increased attention this week amid key UK economic releases and rising political uncertainty around PM Starmer.
USD opens higher on safe haven inflows
The USD opened higher in today’s Asian session, ass market worries for a possible escalation of the US-Iran conflict re-emerged, providing the USD with safe haven inflows. Nevertheless, the USD corrected lower against its counterparts in the FX market as the session progressed, implying that it may have been a market overreaction. We turn our attention on the release of Canada’s March CPI rates just before the American session starts, and a possible wider than expected acceleration could provide some support for the Loonie. Similarly we also note the release of New Zealand’s CPI rates for Q1 26 and a possible wider slow down than expected could weigh on the Kiwi. Yet we highlight the GBP as a currency that may generate substantial interest throughout the week in the FX market. Tomorrow, we note the release of UK’s February employment data, on Wednesday we get UK’s CPI rates for March and on Friday we get UK’s retail sales for March. On fundamental level, we note that UK PM Starmer is under pressure to resign, which tends to raise the spectre of political instability for pound traders.
Xlence Research Team opinion
For the time being we continue to view USD’s safe haven status as the main determinant behind its direction and should the market mood turn more risk on we may see the USD losing ground, while on the contrary as possibly more cautious approach of the market could provide some support for the greenback.
GBP/USD H4 Chart
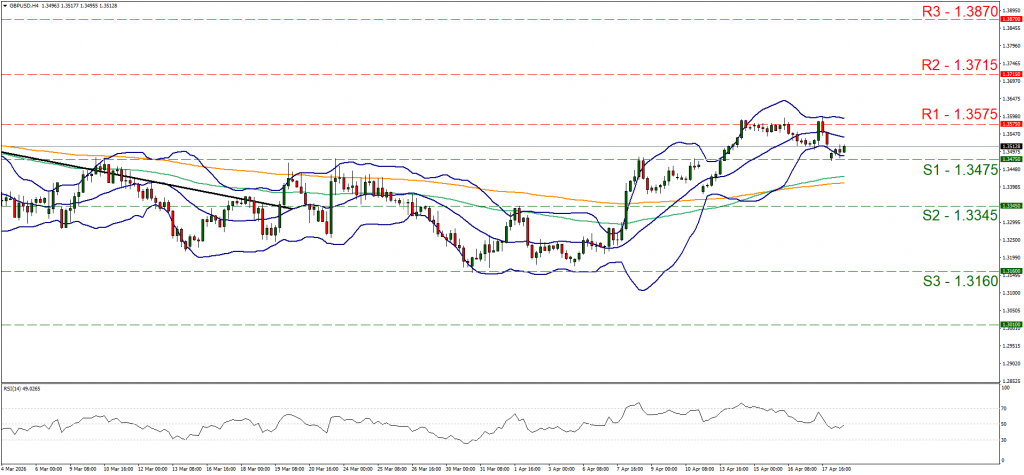
- Support: 1.3475 (S1), 1.3345 (S2), 1.3160 (S3)
- Resistance: 1.3575 (R1), 1.3715 (R2), 1.3870 (R3)
Cable’s price action seems to be confined by the 1.3475 (S1) support line and the 1.3575 (R1) resistance level. We maintain a bias for GBP/USD’s sideways motion to continue at the current stage, given also that the RSI indicator seems to have reached the reading of 50, implying a rather indecisive market. For a bullish outlook to emerge, we would require GBP/USD to break the 1.3575 (R1) resistance line and start aiming for the 1.3715 (R2) resistance level. For a bearish outlook to emerge, we would require GBP/USD to break the 1.3475 (S1) support line and start aiming for the 1.3345 (S2) support level.
US equities remain at high levels
Major US stock market indexes opened slightly lower, yet overall tended to remain at near record high levels, in a signal of confidence on behalf of market participants. We still view the US-Iran conflict as a major issue on a fundamental level, for US equities, yet also note that the earnings season for US stock markets is currently at full swings and company’s releasing their earnings report are making headlines. In the current week we note the release of Rio Tinto today in the after market hours, BHP group tomorrow, on Wednesday we get the reports of Tesla and IBM, on Thursday we get Intel’s earnings report and on Friday we get P&G’s figures.
Xlence Research Team opinion
The market mood remains the main issue for US equities on a fundamental level. Thus a possible easing of the market’s worries for the developments of the US war on Iran could provide some support for US stock markets, while also better than expected EPS and revenue figures, accompanied possibly by confident forward guidance, from key, high-profile companies could also improve the mood and provide a lift for US stock markets.
US 30 Cash H4 Chart
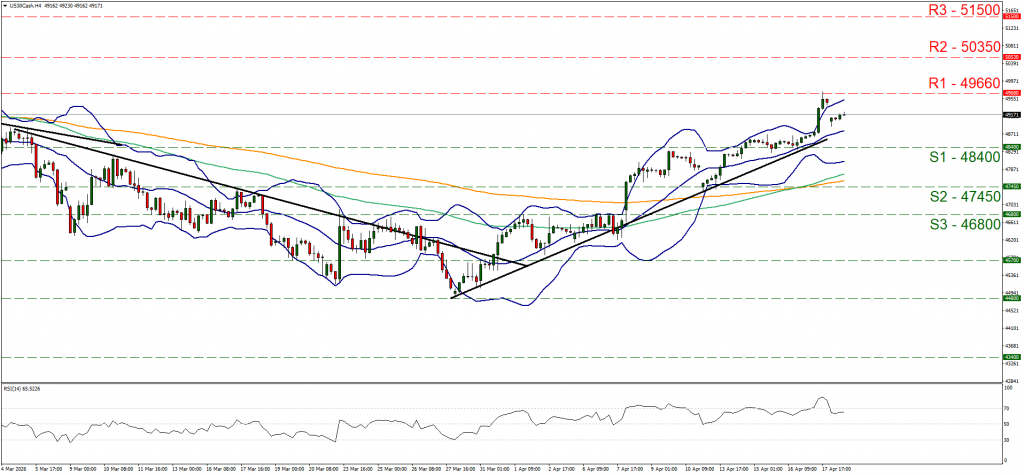
- Support: 48400 (S1), 47450 (S2), 46800 (S3)
- Resistance: 49660 (R1), 50350 (R2), 51500 (R3)
Dow Jones opened lower in today’s Asian session, yet seems to be re-approaching the 49600 (R1) resistance line. The upward trendline guiding it seems to have remained intact allowing to maintain a bullish outlook for the index. Also the RSI indicator seems to remain just below the reading of 70, implying the presence of a bullish market sentiment for the index. We set as the next possible target for Dow Jones’ bulls the 49660 (R1) resistance line. Should the bears take over, we may see Dow Jones’ price action breaking the prementioned upward trendline, in a first signal of an interruption of the upward movement and continue lower to 48400 (S1) support line and then start aiming for the 47450 (S2) support level.
Oil bears seem to hesitate
Oil prices tumbled on Friday as Iran announced that the Straits of Hormuz would opened and the international oil market increased its hopes for a possible peace deal in the US-Iran conflict. Yet over the weekend the US seized an Iranian oil tanker, causing the market to hesitate. It’s indicative that Iran is now reported to be hesitant on further negotiations with the US in Pakistan this week. Market worries are now enhanced for a possible escalation in the conflict once again causing oil prices to open at a higher price today.
Xlence Research Team opinion
We continue to view the path of oil prices as bumpy and understandably the US war on Iran is the main issue affecting them. Should we see market worries intensifying once again, we may see oil prices rising once again, while should the market be more hopeful for a peaceful resolution, we may see oil prices dropping.
WTI H4 Chart
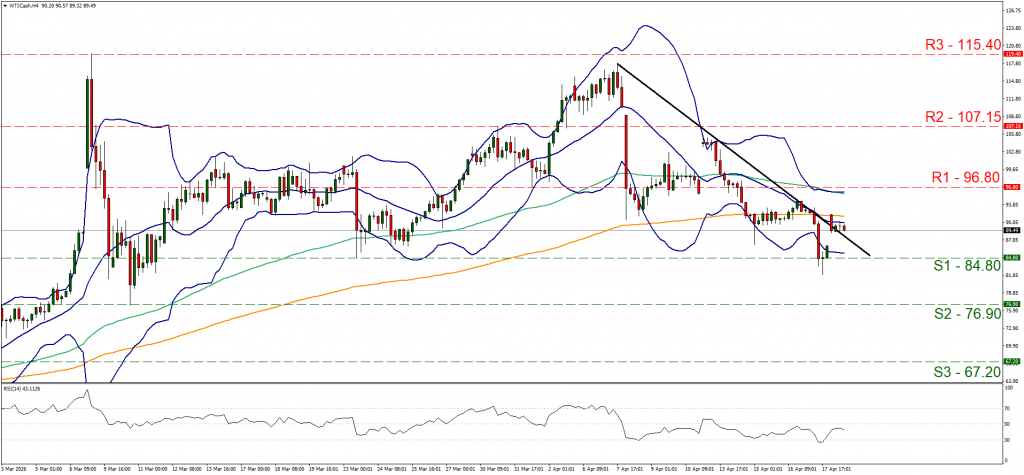
- Support: 84.80 (S1), 76.90 (S2), 67.20 (S3)
- Resistance: 96.80 (R1), 107.15 (R2), 115.40 (R3)
WTI’s price opened higher today and with a small correction lower and continued to stabilise between the 96.80 (R1) resistance line and the 84.80 (S1) support level. The RSI indicator is just below the reading of 50, implying an easing of the market bearish sentiment, which could allow the sideways motion to continue yet may also imply that a bearish predisposition may still exist. In any case WTI’s price action seems to have broken the downward trendline guiding it, which forces us to temporarily alter our bearish outlook in favour of a sideways motion bias. Nevertheless, should the bears regain control over WTI’s price action, we may see it breaking the 84.80 (S1) support lien and start aiming for the 76.90 (S2) support level. Should the bulls take over, we may see WTI’s price action, breaking the 96.80 (R1) resistance line and start aiming for the 107.15 (R2) resistance level.
Gold’s price remains stable
Gold’s price despite some outbursts on Friday tended to remain relatively stable. We continue to view the precious metal’s price as being more sensitive to the movements of the USD rather than directly to geopolitical risks at the current stage. On a physical level, we note the gold buying festival in India, albeit demand seems to be lower than expected, so no major effect from that direction either.
Xlence Research Team opinion
We do not expect major changes in gold’s price at the current stage, yet should we see the USD losing substantial ground, we may see gold’s price getting some support while should the USD be on the rise, we may see gold’s price retreating.
XAU/USD H4 Chart
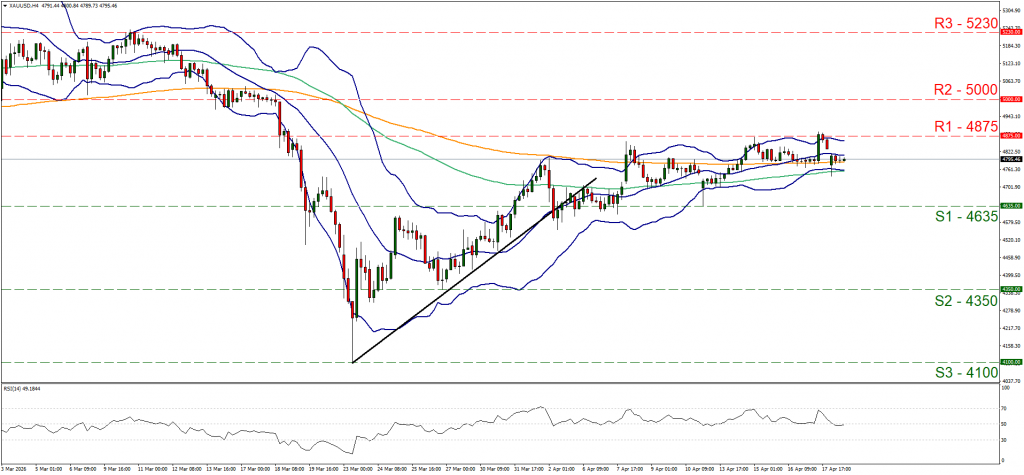
- Support: 4635 (S1), 4350 (S2), 4100 (S3)
- Resistance: 4875 (R1), 5000 (R2), 5230 (R3)
Gold’s price took a swing at the 4875 (R1) resistance line, yet failed to break it and the price action was forced to correct lower. We maintain our bias for gold’s price to continue its sideways motion between the 4875 (R1) resistance line and the 46.35 (S1) support level, for the time being. Also the RSI indicator remains near the reading of 50 implying a rather indecisive market and the narrowing of the Bollinger Bands, both tend to support our bias. Should the bulls take over, we may see the gold’s price breaking the 4875 (R1) resistance line and start aiming for the 5000 (R2) resistance level. Should the bears take over, we may see gold’s price breaking the 4635 (S1) support line and start aiming for the 4350 (S2) support level.
Disclaimer: This information is not considered investment advice or an investment recommendation, but instead a marketing communication.