
There has been little change for gold’s price since our last report, implying a continuance of the wait and see stance on behalf of market participants. In today’s report we are to examine gold’s correlation with other trading instruments, the latest developments in Trump’s trade wars and also any financial releases that could affect gold’s price in the coming week. We are to conclude the report with a technical analysis of gold’s daily chart. On a fundamental level, we note the following:
- Over the past few weeks we saw the USD gaining some ground against its counterparts as the USD Index was on the rise, while since last Wednesday gold’s price was also on the rise. Hence the negative correlation of gold with the USD seems to have been interrupted. We would also like to note that silver’s price has been rallying since last Thursday, yet one cannot claim a positive correlation as gold’s price action had only limited gains in the same days. It’s characteristic that the dynamics in the price movement of the two metals differ substantially over the past three months, as silver’s price rose 34%, while gold’s price rose only 13%. US yields despite some intense movement over the past week, have landed near the same levels as these lines are written, so once again the competitive relationship between US bonds and gold’s price for safe haven status does not seem to be in effect at the current stage.
- On a deeper fundamental level, we note that some analysts are highlighting the intensification of Trump’s trade wars as a factor that could be providing safe haven inflows for the precious metal. In a latest development US President Trump stated that the US is to impose 30% tariffs on products from the EU and Mexico entering the US from the 1st of August onwards. The EU and Mexico have criticized the US intentions and we may see more efforts and negotiations being made to lift the impasse. Yet hopes for a positive ending of the negotiations are low currently. Overall traders seem to have become tired from the frictions in the international trade relationships and its characteristic that market movements have become less intense. Nevertheless, we may see more high impact developments emerging from the issue thus we advise caution for gold traders. Should we see trade frictions intensifying further say for example in case of substantial EU and Mexican countermeasures we may see gold’s price rising as uncertainty may rise given that stakes are high.
- As for notable financial releases in the coming days we would like mention the release of the US CPI rates for June, tomorrow Tuesday. Both the core and headline rates are expected to accelerate which would imply a relative persistence, some may argue an intensification, of inflationary pressures in the US economy. Should the rates show a wider acceleration of the CPI rates we may see the release weighing on gold’s price. On the flip side should the rates fail to accelerate as widely as expected, or even should the rates slow down implying an easing of inflationary pressures in the US economy, we may see gold’s price getting some support.
- Last but not least we note the Fed’s stance as a key factor in gold’s direction. Since our last report the Fed’s last meeting minutes were released and the document showed that there is wide support for more rate cuts until the end of the year. Yet at the same time there seems to be some uncertainty for the extent of the easing of the bank’s monetary policy as well as for its timing. Also rumors for a possible resigning of the Fed’s Chairman, Jerome Powell, were spreading near the end of the past week. Should such rumors intensify in the coming week we may see gold’s price getting some support as market expectations for an easing of the bank’s monetary policy could intensify.
Gold technical analysis
Gold’s price edged slightly higher since our last report and during todays’ Asian session was testing the 3366 (R1) resistance line and even rose slightly above it, yet no clear breach was achieved. The precious metal’s price action remains in a sideways direction, and its’ characteristic that the Bollinger bands remain flat and narrowed a bit implying low volatility for gold’s price, which in turn could allow the sideways motion to continue. On the other hand, the testing of the 3366 (R1) resistance line and RSI indicator which has reached above the reading of 50, imply the awakening of some slight bullish tendencies for gold’s price. Yet for a bullish outlook to emerge we would require gold’s to break clearly the 3366 (R1) resistance line and start aiming for the 6500 (S2) support level, which is an All Time High level for gold’s price. For a bearish outlook to be adopted, which is a more remote scenario at the current stage, we would require gold’s price to reverse direction, drop and break the 3200 (S1) support line, thus opening the gates for the 3057 (S2) support level.
XAU/USD Daily Chart
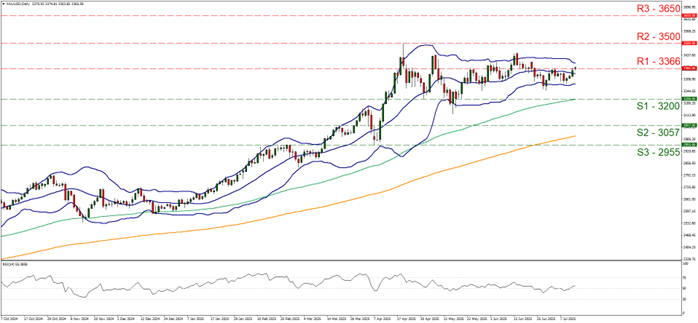
- Support: 3200 (S1), 3057 (S2), 2955 (S3)
- Resistance: 3366 (R1), 3500 (R2), 3650 (R3)