- Lack of interest but also fundamental developments can best characterize the situation that crude futures are currently facing, with neither the bulls nor the bears having strong enough resolve of getting control of the direction of the commodity.
- Even though the Federal Reserve lowered its key benchmark rate by 25bps yesterday and signalled
its intents at lowering further its policy rates, energy markets remain somewhat cautious and
unreactive to the prospects of higher demand (stemming from looser financial conditions) and
remained fixated upon prospects for softer economic growth. - As for the latest crude oil inventory data, EIA showcased a surprise drawdown of 9 million barrels of
crude over the past week, the most in three months, signalling rekindling of the demand function,
which aided prices slightly higher this week. API stocks showcased similar trend, with stockpiles
dwindling with twice the pace analysts forecasted. - Finally, drone strikes from both Russia and Ukraine against each other and the shutdown of key
infrastructure sites and refineries kept supply disruption worries alive alongside the threats from US
President Trump who continues to broadcast the US’s readiness of imposing “major” sanctions on
Russia if NATO countries and Europe take similar steps
Technical Analysis of Oil
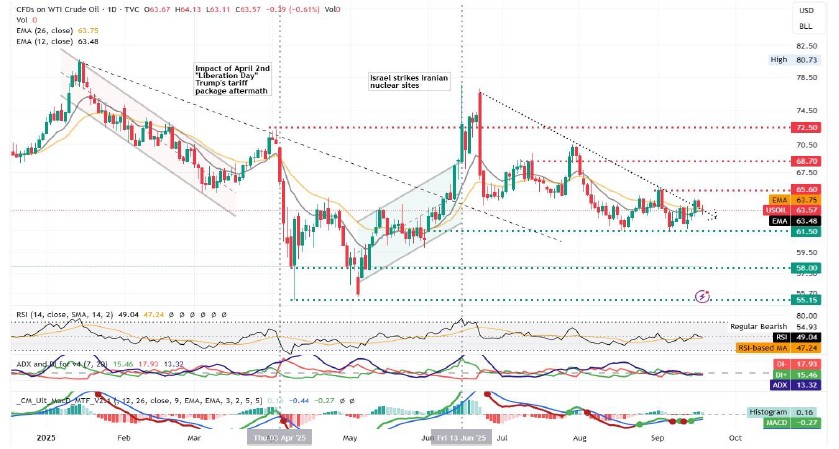
WTI Chart – Crude temporarily bottoms above the $61 per barrel area possible charge of the $65 area at bay

- Resistance: 65.60 (R1), 68.70 (R2), 72.50 (R3)
- Support: 61.50 (S1), 58.00 (S2), 55.15 (S3)
Buying and selling pressures neutralized each other this week and crude futures are currently gyrating
around the $64 per barrel area, striving to keep the distance from the $61.50 (S1) base area intact. Given
the lack of substantial fundamental catalysts and the failure of the bears of breaching the $61.50 level, we
are forced to alter our bias from bearish to a sideways scenario for the time being.
Supporting our case is an RSI value that interchangeably crosses above and below the 50 level for some time now, alongside the ADX value that plummeted to the 13 level, due to lack of strength from either the bulls or the bears. +DI and -DI values are also below the 20 threshold, highlighting absence of substantial interest from either side.
We note however, that in the scenario where the bulls find enough resolve, drive price action decisively
above the descending trendline and lead the charge of the $65.60 (R1) resistance ceiling, we would be
forced to consider a possible change of our assessment and lean towards a bullish bias. Should on the other hand, the bears regain control and drive prices lower, we would require first seeing a successful break of the $61.50 (S1) support area before altering our bias towards the bearish side.
