- Gold gains some positive traction following a three-day downfall to an over three-week low.
- The US-China trade optimism could cap gains for the bullion amid some USD buying interest.
- Traders might also opt to wait for the outcome of a two-day FOMC monetary policy meeting.
Gold (XAU/USD) builds on its intraday ascent through the first half of the European session on Wednesday and climbs further beyond the $4,000 psychological mark, back closer to the overnight swing high. The commodity now seems to have snapped a three-day losing streak as traders keenly await the outcome of a two-day FOMC policy meeting before positioning for the next leg of a directional move. In the meantime, dovish Federal Reserve (Fed) expectations turn out to be a key factor driving flows towards the non-yielding yellow metal.
Meanwhile, the US Dollar (USD) gains some positive traction amid some repositioning trade ahead of the key central bank event risk. Moreover, the optimism led by signs of easing trade tensions between the US and China – the world’s two largest economies, might contribute to keeping a lid on any further upside for the safe-haven Gold. This makes it prudent to wait for some follow-through buying before confirming that the recent corrective fall from the all-time peak has run its course and placing fresh bullish bets around the XAU/USD pair.
Daily Digest Market Movers: Gold scales higher amid some repositing ahead of Fed
- Signs of progress in US-China trade discussions eased concerns about an all-out trade war between the world’s two largest economies and dragged the safe-haven Gold below the $3,900 mark, or an over three-week low on Tuesday.
- In fact, top officials from the US and China agreed over the weekend on a framework for a potential deal for US President Donald Trump and Chinese President Xi Jinping to review at their summit meeting this week, on Thursday.
- However, expectations that the US Federal Reserve (Fed) will lower borrowing costs by 25 basis points at the end of a two-day meeting on Wednesday and deliver another rate cut in December help limit losses for the non-yielding yellow metal.
- The upside for he commodity, however, is more likely to remain capped as traders opt to wait for more cues about the Fed’s rate-cut path before confirming that the recent retracement slide from the all-time peak has run its course.
- The Senate failed to advance a Republican-backed funding bill to end the government shutdown for the 13th time on Tuesday, underscoring a deadlock in Congress. Meanwhile, a US federal judge granted a preliminary injunction, indefinitely barring the Trump administration from firing federal employees during the ongoing government shutdown.
- The US announced new sanctions on Russia’s two biggest oil companies. Moreover, the White House also cancelled a planned meeting between Trump and Russian President Vladimir Putin in Budapest. This signals strain between the US and Russia, which keeps geopolitical risks in play and might continue to support the safe-haven precious metal.
Gold could extend the recovery momentum beyond the $4,050-4,060 intermediate barrier
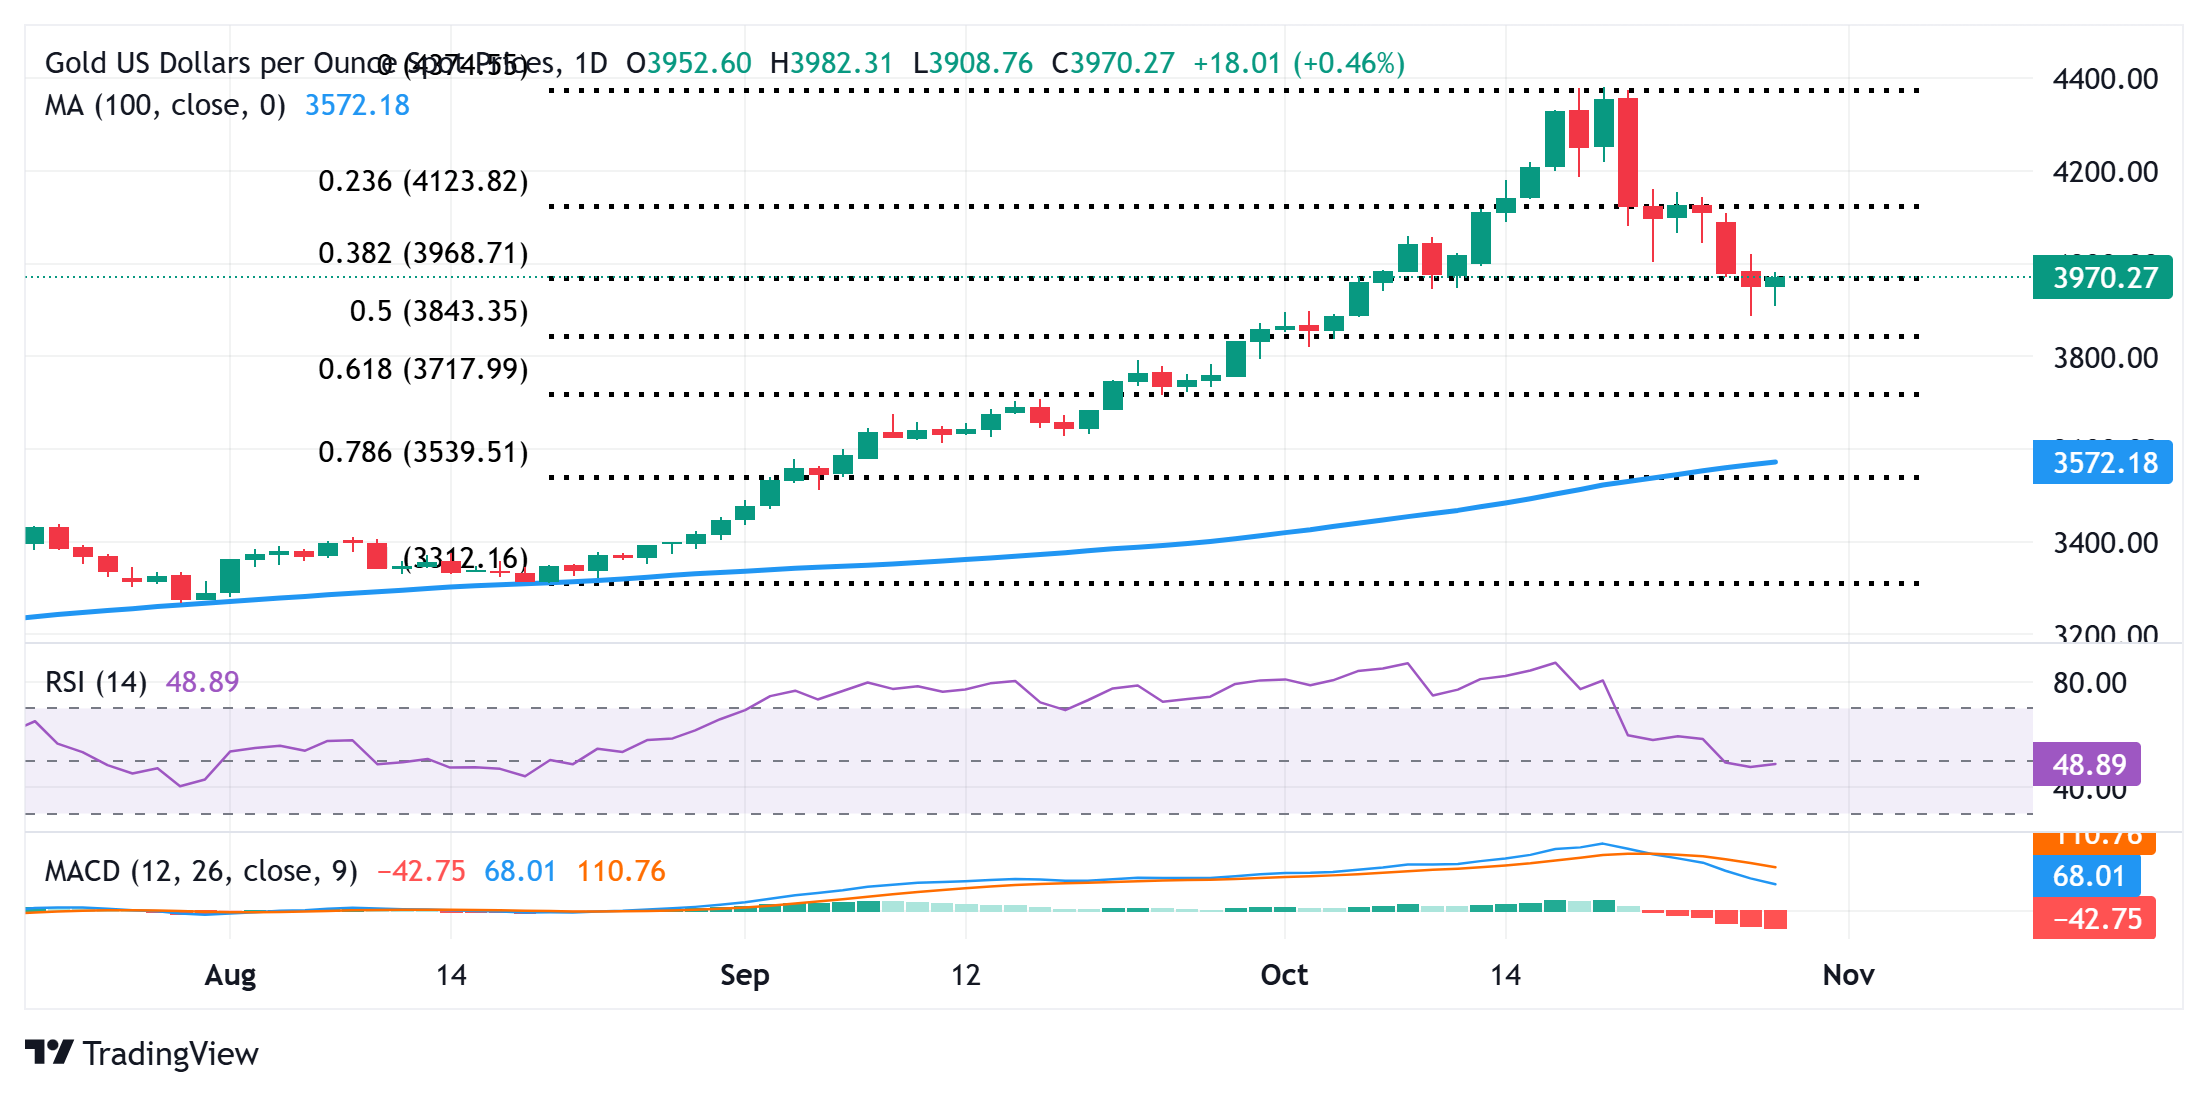
The overnight close below the 38.2% Fibonacci retracement level of the August-October rally could be seen as a fresh trigger for the XAU/USD bears. Moreover, oscillators on the daily chart have just started gaining negative traction and back the case for an extension of the recent corrective decline witnessed over the past week or so. That said, a sustained recovery back above the $4,000 psychological mark could trigger a short-covering rally and lift the Gold price to the $4058-4,060 intermediate hurdle en route to the $4,100 round figure.
On the flip side, the Asian session trough, around the $3,917-3,916 region, the $3,900 mark, and the $3,886 zone, or the overnight swing low, could protect the immediate downside. This is followed by the 50% retracement level, near the $3,844-3,843 area, below which the Gold price could weaken to the $3,800 round figure. The downward trajectory could extend further towards the $3,765-3,760 intermediate support en route to the $3,720-3,715 region, or the 61.8% Fibo. retracement level.
US Dollar Price Today
The table below shows the percentage change of US Dollar (USD) against listed major currencies today. US Dollar was the strongest against the British Pound.
| USD | EUR | GBP | JPY | CAD | AUD | NZD | CHF | |
|---|---|---|---|---|---|---|---|---|
| USD | 0.19% | 0.43% | 0.11% | -0.03% | -0.26% | -0.01% | 0.38% | |
| EUR | -0.19% | 0.25% | -0.07% | -0.21% | -0.44% | -0.19% | 0.20% | |
| GBP | -0.43% | -0.25% | -0.30% | -0.46% | -0.69% | -0.43% | -0.04% | |
| JPY | -0.11% | 0.07% | 0.30% | -0.14% | -0.37% | -0.11% | 0.28% | |
| CAD | 0.03% | 0.21% | 0.46% | 0.14% | -0.24% | 0.02% | 0.42% | |
| AUD | 0.26% | 0.44% | 0.69% | 0.37% | 0.24% | 0.26% | 0.65% | |
| NZD | 0.00% | 0.19% | 0.43% | 0.11% | -0.02% | -0.26% | 0.39% | |
| CHF | -0.38% | -0.20% | 0.04% | -0.28% | -0.42% | -0.65% | -0.39% |
The heat map shows percentage changes of major currencies against each other. The base currency is picked from the left column, while the quote currency is picked from the top row. For example, if you pick the US Dollar from the left column and move along the horizontal line to the Japanese Yen, the percentage change displayed in the box will represent USD (base)/JPY (quote).