Gold’s price continued to be on the rise since our last report, reaching new record high levels and leaving gold traders wondering when it will hit the ceiling. In today’s update we are to examine whether the negative correlation of the USD with gold’s price remains inactive and also have a look at the effect on gold’s price of fundamental factors such as the US Government shutdown and the Fed’s stance. We are to conclude the report with a technical analysis of Gold’s daily chart for a rounder view.
- We are making a start by examining the negative correlation of the USD with gold’s price. Gold’s price got a push higher last Monday and continued to rise each and every day of the past week with the exception of Thursday. In any case since last Monday gold’s price landed at higher grounds. On the other hand the USD index which describes the movement of the USD against a basket of other currencies, was weakening on Monday and tended to stabilise in the following days while today was on the rise since the start of the Asian session similarly to the rise of gold’s price. Hence we tend to view the negative correlation of the USD with gold’s price as being currently inactive. Furthermore, we note that US bond yields tended to fall over the beginning of the past week, yet seemed to also recover since Wednesday. Yet the rise of US bond yields tended to leave gold traders unimpressed as despite the rise of US bond yields gold’s price continued to rise.
- An issue that tended to feed gold bulls with safe haven inflows for the precious metal was the US Government shutdown. We had mentioned the possibility of US Government shutdown in our update last week and the issue is still ongoing, enhancing uncertainty among market participants for the US outlook. The White House has renewed its threat for mass layoffs should shutdown negotiations bring no result. Both sides seem to continue to dig in with US President Trump seeming determined to impose his will, while on the flip side Democrats pressuring for health care subsidies. As a direct result of the US Government shutdown, key financial releases like the US employment report for September that could provide a deeper insight into the state of the US employment market, was delayed, enhancing the uncertainty for the US economic outlook. We continue to view the issue as a factor creating uncertainty and should it be prolonged further, we may see gold’s price getting additional support.
Another issue that could tantalize gold traders over the coming week could be the Fed’s stance. For the time being the market’s dovish expectations for the Fed’s intentions tends to provide support for gold. Yet the US Government shutdown, with a slowdown of the US economy, a potential hit on the US employment market and the delay of the release of key US financial data may force the bank’s arm to follow a more extensive rate cutting path to support the US employment market.
Let’s not forget that some Fed policymakers including recently appointed Fed Board Governor Stephen Miran are pushing for a more aggressive rate cutting path, yet Fed Chairman Powell seems to maintain his doubts. On the other hand the bank may take a break in its next meeting on the 28-29th of October.
We highlight the release of the Fed’s September meeting minutes on Wednesday and should the document reaffirm or even enhance the market’s expectations for the bank to ease its monetary policy we may see gold’s price getting some support. Also on Thursday the bank is to release Fed Chairman Powell’s pre-recorded welcome remarks before the Community Bank Conference. Should the Fed Chairman’s doubts2) support base.
Technical analysis
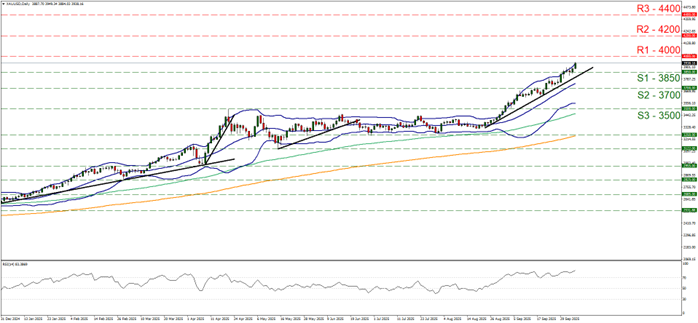
On a technical level, we note that gold’s price continued to rally since our last report breaking the 3850 (S1) resistance line now turned to support and is currently aiming for the 4000 (R1) resistance level. We intend to maintain our bullish outlook as long as the upward trendline guiding gold’s price since the 22nd of August remains intact. The RSI indicator remains well above the reading of 70, implying a strong bullish market sentiment for gold, yet at the same time reminding traders that gold is at overbought levels and is ripe for a correction lower.
Similar signals are being sent by the price action reaching the upper Bollinger band. Should the bulls continue leading gold’s price, we may see it breaking the 4000 (R1) line and start aiming for the 4200 (R2) level. Should the bears take over, we may see gold’s price breaking the 3850 (S1) support line, continuing lower to break the prementioned upward trendline in a first signal of an interruption of the upward movement and continuing to breach also the 3700 (S2) support level, with the next possible target for the bears being set at the 3500 (S3) support barrier.
XAU/USD Daily Chart

- Support: 3850 (S1), 3700 (S2), 3500 (S3)
- Resistance: 4000 (R1), 4200 (R2), 4400 (R3)
