Gold’s price was on the rise after the Fed cut rates and signaled that more easing of its monetary policy is in the pipeline. We are to have a look at the Fed’s decision and how the bank’s stance could affect gold’s price onwards, but also have a look at the negative correlation of the USD with gold and finally have a look at financial releases that could affect gold’s price in the coming days. For a rounder view we are to examine the behavior of gold’s price and its outlook by providing an a technical analysis of gold’s daily chart.
- The Fed’s interest rate decision may have been the key factor behind the recent rise of gold’s price. The bank cut rates as was widely expected by 25 basis points and signalled that there is more easing down the way. It’s characteristic that if one analyses the forward guidance, that the new dot plot showed that Fed policymakers expect two more interest rate cuts to be delivered until the end of the year. We note that the market, as per Fed Fund Futures (FFF), currently seems to expect the bank to proceed with rate cuts in the October and December meetings, take a breather in January and cut rates again early next spring. The market’s expectations are clearly leaning on the dovish side. Yet at the same time we would note that Fed Chairman Powell in his press conference signalled that the bank is in no hurry to ease its monetary policy further, which could imply that the policymaker’s intentions are not carved in stone. We still view the bank’s intentions as being heavily data dependant on both fronts that being inflation and employment. Tomorrow we highlight the speech of Fed Chairman Jerome Powell about the US economic outlook, and should he signal further doubts for the necessity of further easing of the bank’s monetary policy, we may see it weighing on gold’s price as the market’s dovish expectations may have to be readjusted.
- In our last update we noted the blurring of the negative correlation of the USD with gold’s price which continued until Thursday, yet since Friday both the USD index and gold’s price were on the rise, signaling an interruption of the negative correlation of the two trading instruments. Also in the past week US Bond yields were on the rise which did not seem to deter considerably gold traders from buying gold proving that also the negative correlation with US bond yields is not in effect for the time being.
- Last but not least, we have a look at US financial releases in the current week’s calendar that could affect gold’s price. The first would be the release of the final GDP rate for Q2 and the rate is expected to remain unchanged at 3.3%yy, if compared to revised release for the same quarter. Should the rate actually remain unchanged we may see it weighing a bit on gold’s price as it would show a robust growth for the US economy, easing any market worries. On the contrary a possible considerable slow down the rate could provide support for the precious metal. On Friday we highlight the release of the Fed’s favourite inflation metric, the PCE rates for August. The rates are expected to remain unchanged at a core level, at 2.9% and to accelerate slightly at a headline level. Overall a resilience of inflationary pressures in the US economy could weigh on gold’s price while a flare up could cause gold’s price to drop substantially as it could ease the market’s dovish expectations notably. On the flip side a possible easing of inflationary pressures in the US economy could add more pressure on the Fed to ease its monetary policy further thus providing support for gold’s price.
Technical analysis
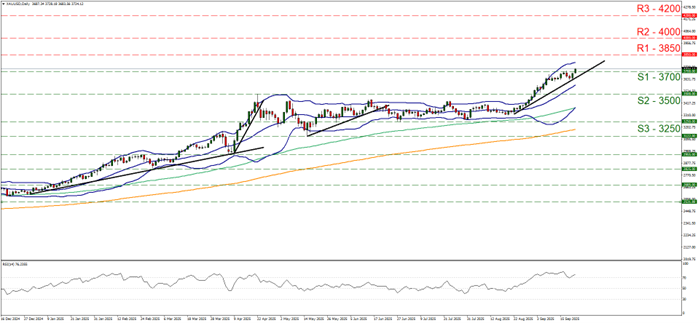
Gold’s price was on the rise today and despite some difficulty over the past week, was able to break the 3700 (S1) resistance line now turned to support. The movement of the precious metal’s price is now preparing to form a new higher peak allowing for an upward trendline to form and for us to re-adopt a bullish outlook as mentioned in last week’s report and we intend to maintain it as long as the upward trendline remains intact.
We also note that the RSI indicator has bounced on the reading of 70 and is slightly rising implying a very strong market sentiment for the precious metal’s price, yet at the same time serves as a reminder for gold traders that gold’s price is at overbought levels and ripe for a correction lower.
On the flip side, we would note though that the price action has some distance from the upper Bollinger band which would imply that the bulls have still room to push gold’s price even higher before a correction lower. Gold’s price on the other hand is at new all-time high levels which may create some hesitation among gold bulls before advancing higher.
Should the bulls maintain control over the bullion’s price as expected, we may see it breaking the 3850 (R1) resistance line and we set as the next possible target for the bulls the 4000 (R2) resistance barrier. On the flip side, should the bears take over, we may see gold’s price tumbling, breaking the 3700 (S1) support level, continue to break the prementioned upward trendline, in a first signal that the upward motion of gold was interrupted again and continue to reach if not breach the 3500 (S2) support base.
XAU/USD Daily Chart

- Support: 3700 (S1), 3500 (S2), 3250 (S3)
- Resistance: 3850 (R1), 4000 (R2), 4200 (R3)
