Since our last report, Gold’s price tended to stabilise after correcting lower and market worries are as to where gold’s price is heading to. In the current report we are to review fundamentals which tend to tantalise the gold market at the current stage. For a rounder view we are also to provide a technical analysis of gold’s daily chart.
- On a fundamental level, the easing of market worries given the Trump-Xi agreement mentioned in last week’s update seems to continue to exercise a bearish effect on gold’s price. Yet there is still a certain degree of uncertainty, as an actual agreement has not been signed but only a framework has been agreed upon. Its characteristic that the US President stated that NVIDIA’s most advanced chips are not to be sold to outside the US, practically excluding China from being able to use them. In any case as long as market worries for the US-Chinese trade relationships continue to ease we may see them leading to further bearish tendencies for gold’s price and vice versa.
- Also we note the release of the Fed’s interest rate decision in the past week. The Fed cut rates by 25 basis points as was widely expected, yet Fed Chairman Powell in his press conference cast a shadow of a doubt the bank’s intentions about future rate cuts. Fed Fund Futures imply that he market still expects the bank to deliver a rate cut in the December meeting yet the expectations have eased after Powell’s comments and the market also expects that further rate cuts are to delayed until spring next year. The question now arises whether Fed policymakers will be following Powell’s lead and set doubt on further easing or not. Should Fed policymakers like Mira, Waller and Bowman continue to support more monetary policy easing, we may see gold’s price getting some support, while should hawks like Schmid and Hammack prevail, we may see gold’s price losing ground.
- Usually we close the fundamentals paragraph of gold’s report with US financial releases that could affect gold’s direction in the coming week, yet given the US government shutdown, the release of high impact releases such as the US employment report for October are to be delayed. Instead the market may focus on what will be available such as the ADP national employment figure for October. Also the ISM PMI figures for the same month could generate interest among traders in search of further clues regarding the level of economic activity in the US economy. A possible drop of the indicators’ readings , beyond market expectations, could enhance the market’s worries about the US macroeconomic outlook and thus could generate safe haven inflows for gold’s price.
Gold Technical analysis
Gold’s price seems to have stabilised since its drop in the past two weeks and on Friday hit a ceiling at the 4045 (R1) resistance line. For the time being we tend to expect the precious metal’s price to remain in a rangebound motion largely within the corridor set by the 4045 (R1) resistance line and the 3915 (S1) support level. The narrowing of the Bollinger bands and the landing of the RSI indicator on the reading of 50 tend to support such an idea, as the indicators imply an easing volatility for gold’s price and a relative indecisiveness on behalf of gold traders regarding the bullion’s price direction. Should the bulls take control over gold’s price we may see it breaking the 4045 (R1) resistance line and starting to aim for the 4160 (R2) resistance level. Should the bears be in charge of gold’s direction, we may see it breaking the 3915 (S1) support line and thus paving the way for the 3790 (S2) support base.
XAU/USD (Gold) Daily Chart
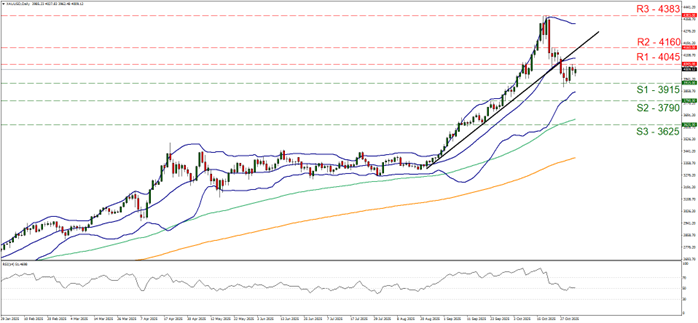
- Support: 3915 (S1), 3790 (S2), 3625 (S3)
- Resistance: 4045 (R1), 4160 (R2), 4383 (R3)