
Gold’s price remained in a sideways motion since our last report. Today we are to take a look at key issues that could possibly affect gold’s price, including the negative correlation of the USD and gold. We are to conclude the report with a technical analysis of gold’s daily chart. We make a start with fundamentals noting the following:
- Over the past two weeks gold’s price remained relatively stable while the USD Index despite its ups and downs also remained relatively stable, blurring the notion of a negative correlation between the two trading instruments being active. Furthermore we also note that US bond yields despite some ups and downs landed higher since last week’s report hence once again we do not see a negative correlation with gold’s price being active.
- On a monetary level, on Wednesday we note the release of the Fed’s interest rate decision and the bank is widely expected to remain on hold with Fed Fund Futures implying currently a probability of 97% for such a scenario to materialise. Yet the market expects the Fed to cut rates in its September and December meeting, thus highlighting a dovish inclination. Hence should the bank remain on hold and in tis forward guidance show that its prepared to keep rates unchanged for longer, we may see the release weighing on gold’s price as the market may have to readjust its expectations, while should the Fed signal that its ready to lower its interest rates we may see gold’s price gaining.
- On a macroeconomic level, we note the release of the US GDP advance rate for Q2 and PCE rates for June, on Wednesday and Thursday respectively, as potential risk events for gold’s price and a possible acceleration of the rates could weigh on gold’s price as it the releases may ease market worries for the US economic outlook and show a possible resilience of inflationary pressures in the US economy. Yet the main release of the week may prove to be the release of the US employment report for July on Friday. Current forecasts are for the NFP figure to drop the unemployment rate to tick up, both implying a possible easing of the US employment market. Should the data show that the cooling of the US employment market for July is wider than expected, we may see gold’s price gaining, while a possible unexpected tightening of the US employment market which would contradict market expectations could weigh substantially on gold’s price.
- On a more fundamental level, we note that Trump’s 1st of August trade deadline is nearing and market worries for the tariffs may intensify, despite a relative numbness in the recent market reactions on the issue. Yet we have to note that Japan and the EU seem to have agreed or are nearing a possible trade deal, with similar blueprints. Both countries’ products are to suffer lower tariffs upon entering US soil, 15%,if one considers that Trump wanted to impose tariffs of 30%. Yet the two countries are also obligated to make significant investments in the US, amounting to half a trillion each. Should there be more trade deals announced we may see market worries easing and thus weighing on gold’s price, while the contrary may happen if market worries escalate further as gold may enjoy safe haven inflows.
Gold technical analysis
Since our last report, gold’s price maintained its sidesways motion and to better reflect that we re-adjusted the R1 elevating it to the record high level of 3500 (R1) resistance level. We maintain our bias for the precious metal’s price to continue between the 3500 (R1) line, and the 3250 (S1) support level.
Supporting our bias are the Bollinger bands which remain narrow, implying a continuation of low volatility for gold’s price while the RSI indicator dropped to the reading of 50, implying an erasing of the bullish sentiment of the market for the pair and at the current stage a relative indecisiveness of market participants for gold’s price.
For a bullish outlook we would require gold’s price to break the 3500 (R1) resistance line and proceed in unchartered waters possibly aiming for the 3650 (R2) resistance level. For a bearish outlook we would require gold’s price to break the 3250 (S1) support line and start aiming for the 3122 (S2) support level.
XAU/USD Daily Chart
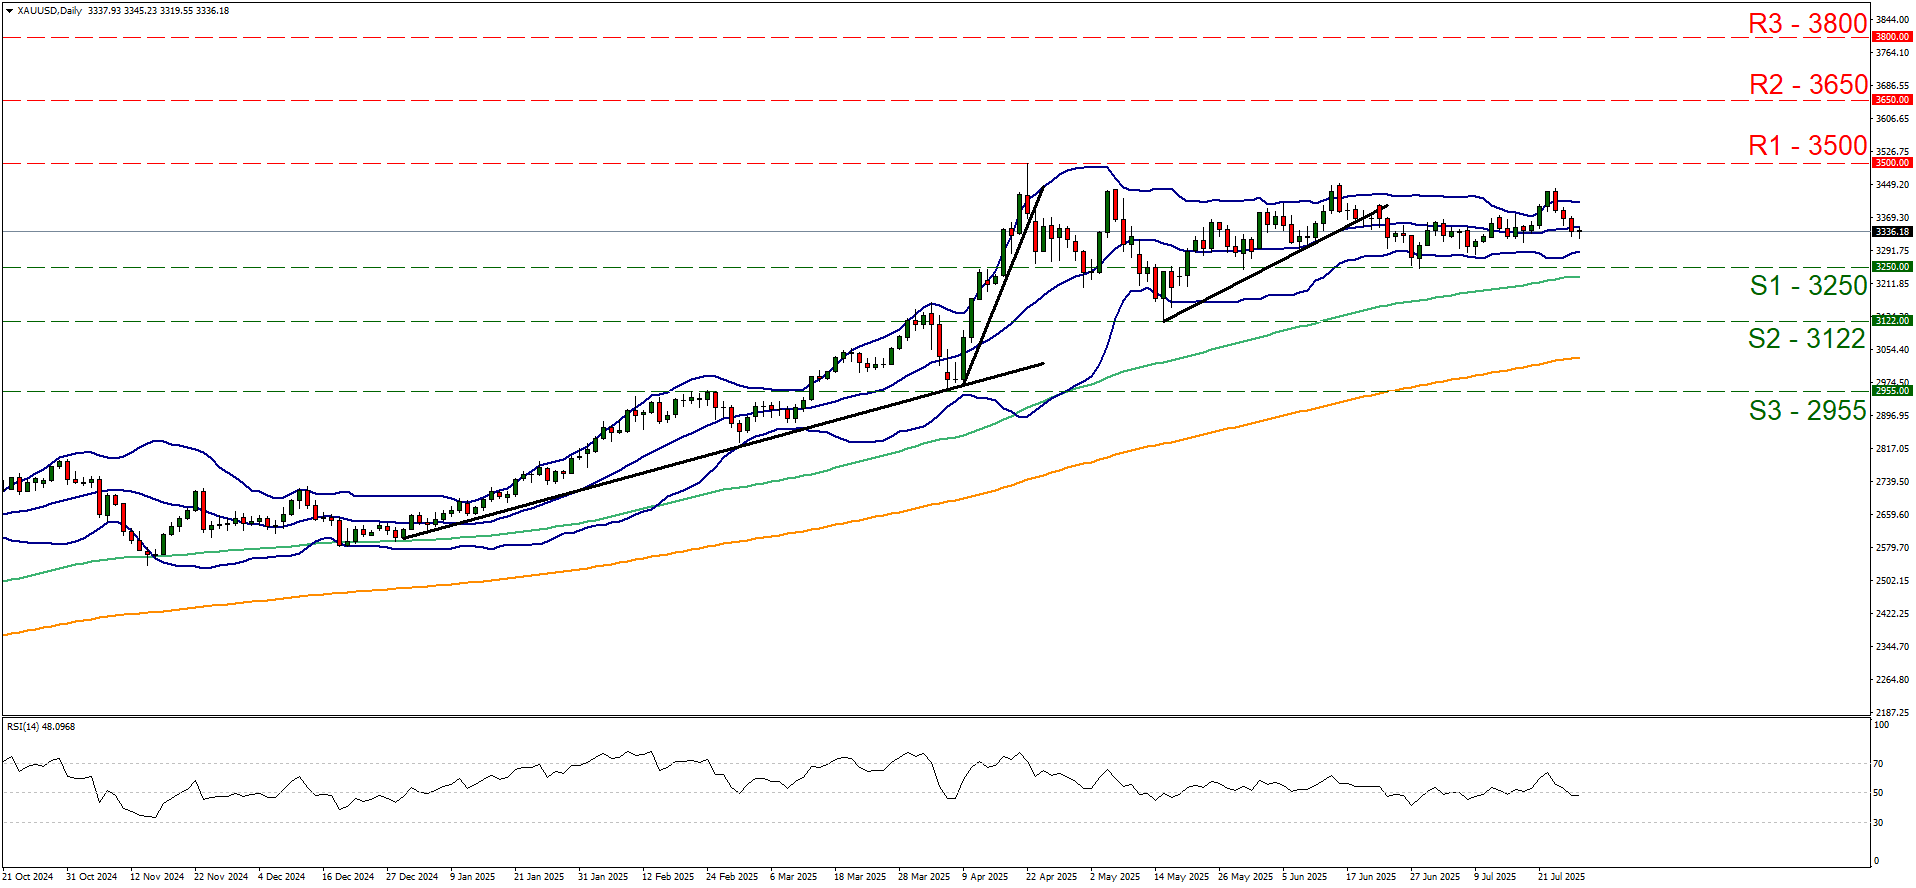
- Support: 3250 (S1), 3122 (S2), 2955 (S3)
- Resistance: 3500 (R1), 3650 (R2), 3800 (R3)


