Successful forex trading isn’t about gut feelings or blind luck. The essential indicators every trader should know form the backbone of profitable market analysis, providing clear signals that separate amateur guesswork from professional decision-making.
These technical tools transform chaotic price movements into readable patterns. They help you spot trends, identify entry points, and manage risk with precision.
This article will explain which technical indicators are crucial for traders, how to use them effectively, and how Xlence platforms can help implement them for better trading results.
Understanding technical indicators
Technical indicators analyse past price data to predict future market movements. They fall into two main categories: trend-following and oscillating indicators.
Trend-following indicators help identify market direction. They work best during strong directional moves but can produce false signals in sideways markets.
Oscillating indicators measure market momentum and overbought or oversold conditions. They excel in range-bound markets but often give premature signals during strong trends.
Most professional traders combine both types. This approach provides a more complete picture of market conditions.
Moving averages: One of the essential indicators every trader should know
Moving averages smooth out price action by creating a constantly updated average price. They’re among the essential indicators every trader should know because of their versatility and reliability.
Simple vs exponential moving averages
- Simple Moving Average (SMA): Calculates the average closing price over a chosen period.
- Exponential Moving Average (EMA): Gives more weight to recent prices, responding faster to market changes.
Popular moving average strategies
Moving average crossovers provide clear trading signals. When a shorter-period MA crosses above a longer-period MA, it suggests an upward trend.
The golden cross occurs when the 50-day MA crosses above the 200-day MA. This classic bullish signal often attracts significant buying interest.
Support and resistance levels form around major moving averages. Price often bounces off the 200-day MA, making it a crucial level to watch.
RSI: Measuring momentum
The Relative Strength Index (RSI) oscillates between 0 and 100. It measures how quickly prices are changing and identifies overbought or oversold conditions.
RSI readings above 70 typically indicate overbought conditions. This suggests prices might fall soon. Readings below 30 suggest oversold conditions and potential buying opportunities.
However, RSI can remain overbought or oversold for extended periods during strong trends. Smart traders look for divergences between price and RSI for more reliable signals.
RSI divergence signals
Bullish divergence occurs when price makes lower lows whilst RSI makes higher lows. This suggests weakening selling pressure and potential upward reversal.
Bearish divergence happens when price makes higher highs whilst RSI makes lower highs. This indicates weakening buying momentum and possible downward reversal.
Traders tend to combine RSI with other indicators to confirm signals and reduce false positives.
MACD: Essential indicators every trader should know for trend analysis
The Moving Average Convergence Divergence (MACD) combines trend-following and momentum characteristics. It consists of the MACD line, signal line, and histogram.
The MACD line equals the difference between a 12-period EMA and a 26-period EMA. The signal line is a 9-period EMA of the MACD line.
When the MACD line crosses above the signal line, it generates a bullish signal. A bearish signal occurs when the MACD line crosses below the signal line.
The histogram shows the difference between the MACD and signal lines. Growing histogram bars indicate strengthening momentum, whilst shrinking bars suggest weakening momentum.
Bollinger Bands: Volatility and mean reversion is one of the essential indicators every trader should know
Bollinger Bands consist of a moving average with upper and lower bands placed two standard deviations away. They expand during volatile periods and contract during quiet periods.
Price tends to bounce between the upper and lower bands. When price touches the upper band, it might reverse downward. Touches of the lower band often precede upward moves.
The Bollinger Band Squeeze: A key move in essential indicators every trader should know
A squeeze occurs when the bands narrow significantly. This indicates low volatility and often precedes significant price movements.
Traders watch for breakouts from squeezed bands. The direction of the breakout usually indicates the next major trend direction.
Volume confirmation strengthens Bollinger Band signals. High volume breakouts are more reliable than low volume ones.
Stochastic oscillator: Timing entries
The Stochastic oscillator compares current closing prices to the price range over a specific period. It consists of %K and %D lines that oscillate between 0 and 100.
Readings above 80 suggest overbought conditions, whilst readings below 20 indicate oversold conditions. However, like RSI, these levels can persist during strong trends.
The most reliable signals occur when %K crosses %D in overbought or oversold territory. A bullish signal forms when %K crosses above %D below the 20 level.
Fibonacci Retracements: Natural support and resistance is one of the essential indicators every trader should know
Fibonacci retracements identify potential support and resistance levels based on mathematical ratios. The key levels are 23.6%, 38.2%, 50%, 61.8%, and 78.6%.
These levels often act as turning points during trend corrections. Price frequently reverses at the 38.2% or 61.8% retracement levels.
Traders combine Fibonacci levels with other indicators for confirmation. A bullish reversal at the 61.8% level with RSI showing oversold conditions creates a high-probability setup.
Average true range: Measuring volatility
The Average True Range (ATR) measures market volatility without indicating direction. It helps traders set appropriate stop losses and position sizes.
High ATR values indicate volatile conditions where wider stops are necessary. Low ATR values suggest calmer markets where tighter stops might work.
Professional traders use ATR multiples for stop placement. A 2x ATR stop gives price room to move whilst protecting against significant losses.
Volume indicators: Confirming price action
Volume indicators analyse trading activity to confirm price movements. High volume during price advances suggests strong buying interest.
The Volume Weighted Average Price (VWAP) shows the average price weighted by volume. It acts as a benchmark for institutional traders and often provides support or resistance.
On-Balance Volume (OBV) adds volume on up days and subtracts volume on down days. Rising OBV with rising prices confirms upward trends.

Essential indicators every trader should know: Combining signals
No single indicator provides perfect signals. The essential indicators every trader should know work best when combined thoughtfully.
Confluence zones where multiple indicators align offer the highest probability trades. For example, price reaching a Fibonacci level whilst RSI shows oversold conditions and MACD signals bullish divergence.
Start with one or two indicators until you understand them completely. Adding more indicators doesn’t automatically improve results and can create analysis paralysis.
Creating your indicator system
Choose indicators that complement each other rather than providing similar information. Combining two momentum oscillators often produces conflicting signals.
A trend indicator paired with a momentum oscillator creates a balanced approach. The trend indicator shows direction whilst the oscillator helps time entries.
Backtesting your chosen combination reveals its historical performance. This helps set realistic expectations and refine your approach.
Platform integration and setup
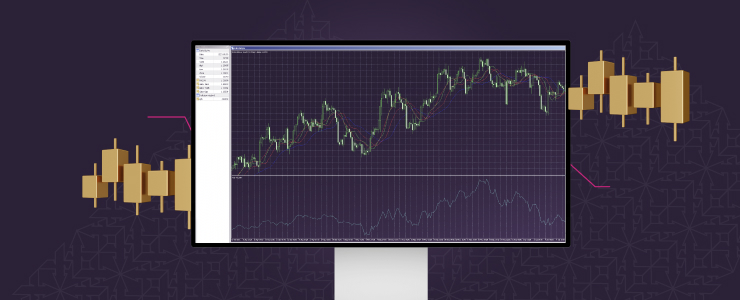
Most trading platforms offer these indicators as standard features. MT5, available via Xlence, includes 38 technical indicators and 44 analytical tools built into the platform, allowing traders to conduct in‑depth technical analysis directly within the charts.
MT4, also offered by Xlence, provides over 30 built‑in technical indicators and charting capabilities. Both platforms allow traders to apply, configure, and customise indicators on charts, save indicator templates, and build personalised layouts.
Default settings work well for beginners, but experienced traders often adjust parameters. Shorter periods create more sensitive indicators, whilst longer periods produce smoother signals.
Save your favourite indicator combinations as templates. This speeds up chart analysis and ensures consistency across different currency pairs.
Final Thoughts
These essential indicators every trader should know provide the foundation for successful technical analysis. They transform complex price data into actionable trading signals when used correctly.
Remember that indicators are tools, not crystal balls. They work best when combined with sound risk management and realistic expectations about market behaviour.
Brokers like Xlence enable traders to analyse indicators efficiently, turning complex price data into actionable insights. Start practising with one or two indicators before expanding your toolkit, mastering basics first, then incorporating additional tools gradually.
DISCLAIMER: This content is for general informational and educational purposes only and should not be considered investment advice or investment recommendation.