
Oil prices moved higher yesterday as fundamentals provided tailwinds for the commodity’s price, while doubts raised for US-Iranian negotiations enhanced market concerns over the possibility that the two sides may fail to reach a mutual agreement for a peace plan.
Despite the US reportedly extending indefinitely the ceasefire with Iran, tensions remain elevated as Iran appears reluctant to restart negotiations and has seized two vessels, while the US continues to block Iranian ports. For the time being, both sides seem to have reached a stalemate, with no clear solution on the horizon, keeping the risk of further escalation in the US-Iran conflict firmly present.
Oil prices gain on negotiations doubts
Oil prices moved higher yesterday as fundamentals provided tailwinds for the commodity’s price. Despite the US extending reportedly indefinitely the ceasefire with Iran, market worries the possibility that the US and Iran will not reach a mutual agreement for a peace plan were enhanced. On the one hand the Iranians seem to hesitate to restart negotiations, while yesterday Iran seized two vessels. On the other hand the US extended the ceasefire, yet at the same time are still blocking Iranian ports. For the time being the two sides seem to have reached a stalemate and no solution is on the horizon, thus the possibility of further escalation in the US Iran conflict is quite present.
Xlence Research Team opinion
We expect the market’s worries to intensify further at the current stage and if so, we may see oil prices getting further support. Should however signals emerge that point towards a restart in negotiations between US and Iran, we may see oil prices falling.
WTI H4 Chart
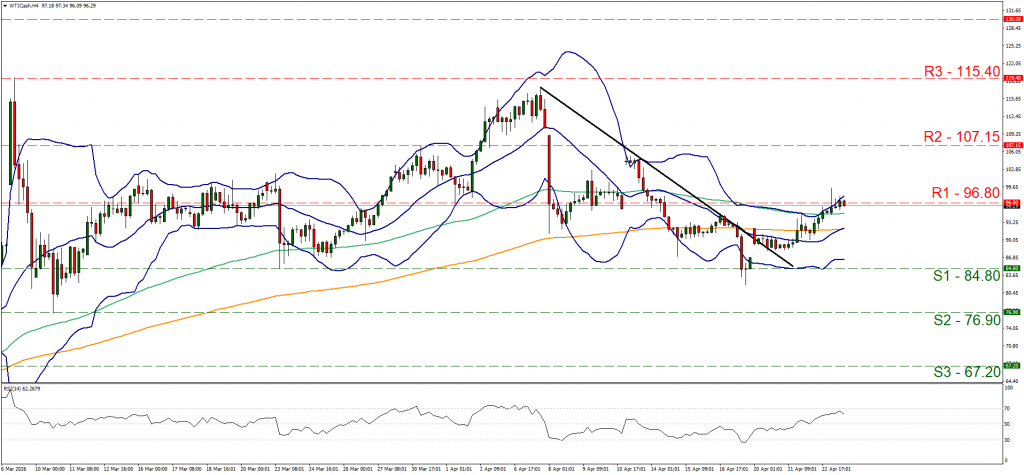
- Support: 84.80 (S1), 76.90 (S2), 67.20 (S3)
- Resistance: 96.80 (R1), 107.15 (R2), 115.40 (R3)
WTI’s price moved higher yesterday and during today’s Asian session, and are currently testing the 96.80 resistance line. The bullish tendencies seem to be intensifying and its characteristic of the bullish market sentiment that he RSI indicator has neared the reading of 70. For a bullish outlook to be adopted, we would require a clear breaking of the 96.80 (R1) resistance line and we set as the next possible target for the bulls the 107.15 (R2) resistance level.
US stock markets send mixed signals
US stock markets seem to be sending some mixed signals, as the S&P 500 remained relatively stable, Nasdaq continued to rise and Dow Jones edged lower. US stock markets seem to have distanced their direction from the US-Iranian conflict at least temporarily. Earnings reports are creating wide headlines, like IBM and Tesla in yesterday’s aftermarket hours and today in the aftermarket hours we note the release of Intel’s earnings report. Overall the earnings reports have shown some solid figures both on an EPS as well as on a revenue level.
Xlence Research Team opinion
Should we see the market’s mood turning more risk on, we may see US equities getting more support. On the other hand, should the market mood turn more cautious, we may see US stock markets ending their day in the reds.
US 500 Cash H4 Chart
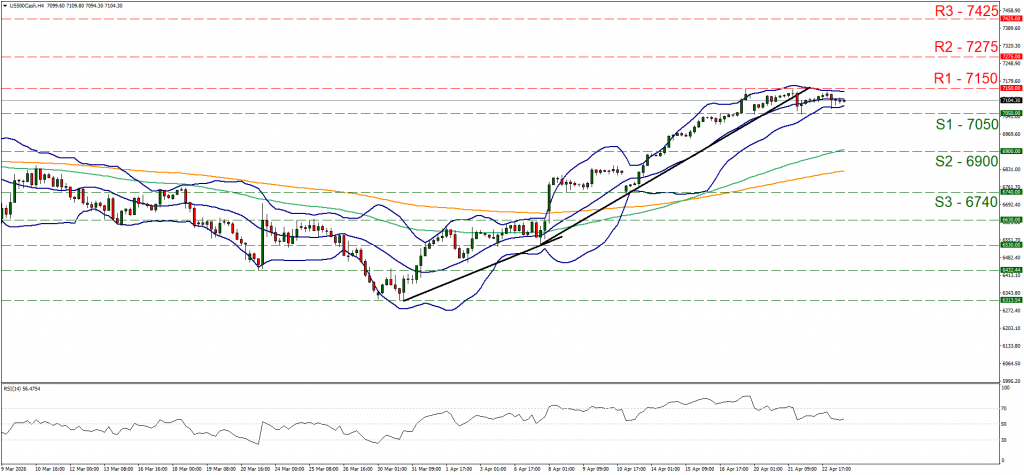
- Support: 7050 (S1), 6900 (S2), 6740 (S3)
- Resistance: 7150 (R1), 7275 (R2), 7425 (R3)
S&P 500, seems to have stabilised in a tight sideways motion between the 7150 (R1) resistance line and the 7050 (S1) support level. The RSI indicator has dropped nearing the reading of 50, implying an easing of the bullish market sentiment for the index. Should the bulls regain control over the index’s price action we may see it breaking the 7150 (R1) resistance line, reaching new All Time High levels and we set as the next possible target for the bulls the 7275 (R2) resistance level. Should the bears take over ,we may see the index breaking the 7050 (S1) support line and start aiming for the 6900 (S2) support base.
USD benefits from its safe haven status
The USD continued to strengthen against its counterparts in the FX market. The intensification of the market’s worries for the US-Iranian conflict allowed the USD safe haven status to provide tailwinds for the greenback. In the FX market today we note the release of the US weekly initial jobless claims figure and the US preliminary PMI figures for April. In tomorrow’s Asian session we highlight the release of Japan’s CPI rates and a possibly wider than expected acceleration could provide some support for the Yen.
Xlence Research Team opinion
We expect USD’s safe haven status to remain the main factor behind its direction. Should we see the market’s worries for the US-Iranian conflict be enhanced, we may see the greenback gaining further and vice versa.
USD/JPY H4 Chart
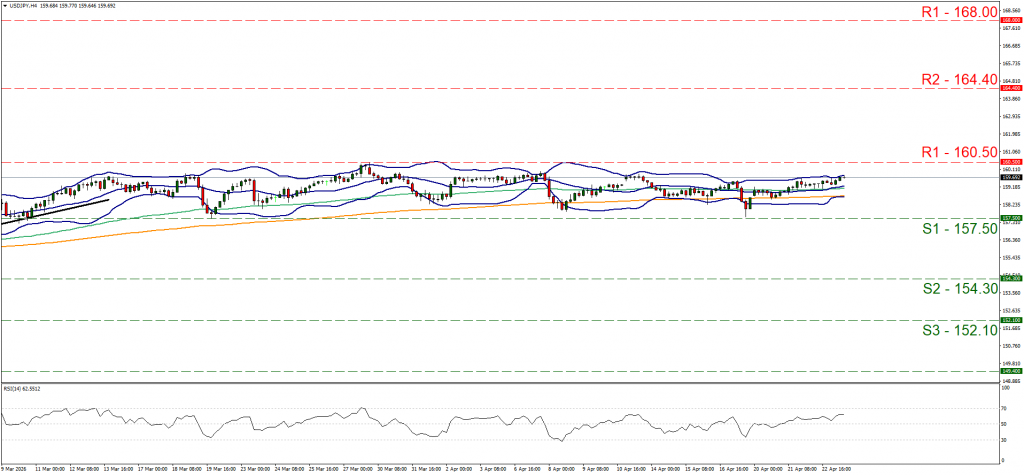
- Support: 157.50 (S1), 154.30 (S2), 152.10 (S3)
- Resistance: 160.50 (R1), 164.40 (R2), 168.00 (R3)
USD/JPY seems to have edged higher today, yet remains well within the boundaries set by the 160.50 (R1) resistance line and the 157.50 (S1) support level. We continue to maintain a bias for the continuance of the sideways motion of the pair within the corridor formed by the prementioned levels. The RSI indicator seems to be rising implying an intensifying bullish market sentiment, yet for the adoption of a bullish outlook we would require USD/JPY’s price action to break clearly the 160.50 (R1) resistance line and start aiming for the 164.40 (R2) resistance level. Should the bears take over, we may see the pair breaking the 157.50 (S1) support line and start aiming for the 154.30 (S2) support barrier.
Gold’s price edged lower
Gold’s price seems to be currently experiencing some bearish pressures. On the one hand the increased market worries for the US-Iran conflict, failed to create some safe haven flows for the precious metal. On the contrary the strengthening of the USD tended to weigh on the precious metal’s price, implying the reactivation of the negative correlation of the USD with gold’s price. Hence we tend to view not the situation in Iran as such as the primary factor behind gold’s price, but the direction of the USD.
Xlence Research Team opinion
Should we see the USD continuing to strengthen, we may see gold’s price retreating further, while a weakening of the USD may benefit gold’s price. Also any signs of a more hawkish approach by the Fed could support the USD and weigh on gold’s price.
XAU/USD H4 Chart
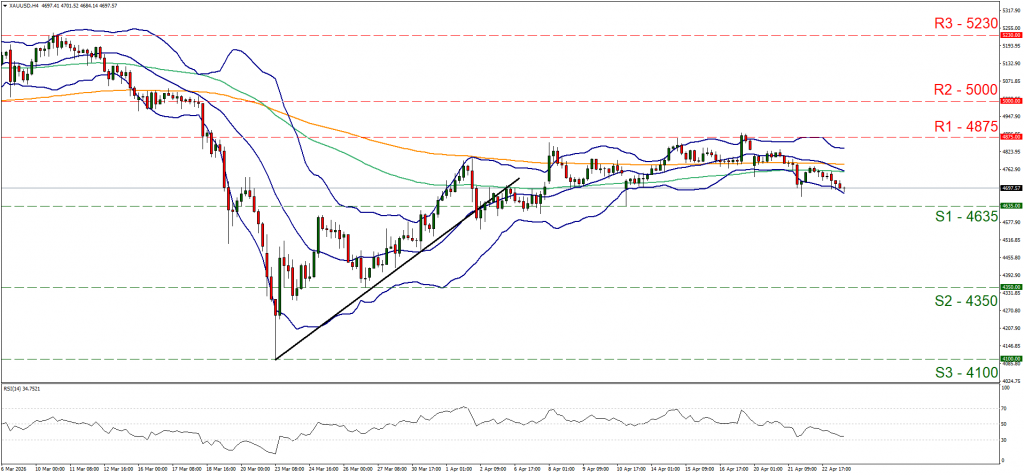
- Support: 4635 (S1), 4350 (S2), 4100 (S3)
- Resistance: 4875 (R1), 5000 (R2), 5230 (R3)
Gold’s price edged lower in the past 24 hours aiming for the 4635 (S1) support line. The RSI indicator is lowering, nearing the reading of 30, implying an intensifying bearish market sentiment for the precious metal’s price. Yet for a full bearish outlook for gold’s price we would require gold’s price to break the 4635 (S1) support line and start aiming for the 4350 (S2) support level.
Disclaimer: This information is not considered investment advice or an investment recommendation, but instead a marketing communication.